Chart of the week

Outlook for private equity return drivers favor middle market?

This week’s chart looks at return drivers for middle market buyout transactions, which have generated higher realized capital multiples than large cap and may favor middle market managers looking forward.

April 5, 2024 | 3 minute read

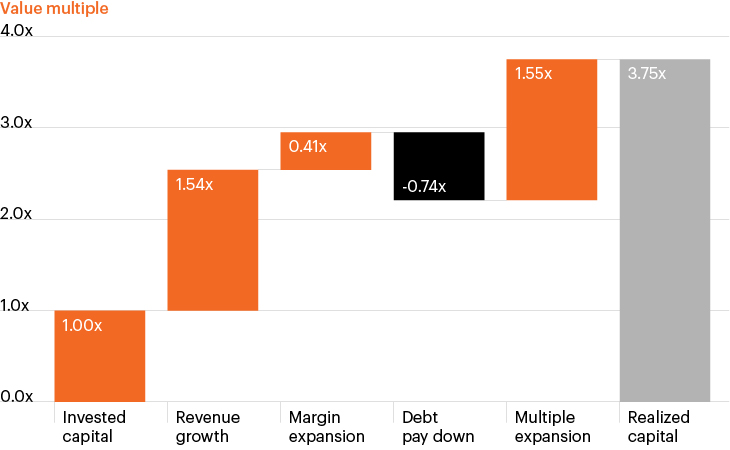
Return drivers for middle market buyout transactions

Source: Preqin, as of February 29, 2024.

  • Today’s higher rate environment provides private equity general partners (GPs) with a more challenging environment to derive value than the zero-interest rate period (ZIRP) that dominated since the global financial crisis. 
  • With higher rates increasing acquisition financing costs, GPs today must rely more heavily on operational improvements such as growing an acquired firm’s revenue, revitalizing management teams or increasing margins to drive value for their limited partners. 
  • Revenue and margin growth play a particularly important role in the value creation process for middle market companies (those with revenues between $10 million to $1 billion).
  • Based on Preqin data, middle market buyout transactions have generated higher realized capital multiples (3.75x) than large cap buyout transactions (3.2x). Compared to large cap buyout transactions, middle market buyouts also derive a higher proportion of value from fundamental improvements like growing revenues than via multiple expansion (selling at a higher valuation than at the entry point). Extremely low financing costs during the ZIRP era helped fuel multiple expansion.1
  • Opportunities for revenue and margin growth may increasingly be top of mind for GPs as margin expansion is likely to face higher borrowing costs. Such an environment may provide particularly fertile ground for middle market private equity managers.

  • Preqin based on data from 2006 through 2019.

The chart of the week and any accompanying data is for informational purposes only and shall not be considered an investment recommendation or promotion of FS Investments or any FS Investments fund. The chart of the week is subject to change at any time based on market or other conditions, and FS Investments and FS Investment Solutions, LLC disclaim any responsibility to update such market commentary. The chart of the week should not be relied on as investment advice, and because investment decisions for the FS Investments funds are based on numerous factors, may not be relied on as an indication of the investment intent of any FS Investments fund. None of FS Investments, its funds, FS Investment Solutions, LLC or their respective affiliates can be held responsible for any direct or incidental loss incurred as a result of any reliance on the chart of the week or other opinions expressed therein. Any discussion of past performance should not be used as an indicator of future results.

This information is educational in nature and does not constitute a financial promotion, investment advice or an inducement or incitement to participate in any product, offering or investment. FS Investments is not adopting, making a recommendation for or endorsing any investment strategy or particular security. All views, opinions and positions expressed herein are that of the author and do not necessarily reflect the views, opinions or positions of FS Investments. All opinions are subject to change without notice, and you should always obtain current information and perform due diligence before participating in any investment. FS Investments does not provide legal or tax advice and the information herein should not be considered legal or tax advice. Tax laws and regulations are complex and subject to change, which can materially impact any investment result. FS Investments cannot guarantee that the information herein is accurate, complete, or timely. FS Investments makes no warranties with regard to such information or results obtained by its use, and disclaims any liability arising out of your use of, or any tax position taken in reliance on, such information.

Any projections, forecasts and estimates contained herein are based upon certain assumptions that the author considers reasonable. Projections are necessarily speculative in nature, and it can be expected that some or all of the assumptions underlying the projections will not materialize or will vary significantly from actual results. The inclusion of projections herein should not be regarded as a representation or guarantee regarding the reliability, accuracy or completeness of the information contained herein, and neither FS Investments nor the author are under any obligation to update or keep current such information.

All investing is subject to risk, including the possible loss of the money you invest.

Search our site