Chart of the week

Trade uncertainty registers parabolic growth

Tariffs have been mentioned nearly 1,000 times on Q1 earnings calls, driving volatility and sowing uncertainty across markets.

Company mentions of “tariffs” and reshoring/supply chain shifts

Line chart showing the number of references to tariffs (orange line) on company earnings calls. Tariff mentions spiked during the first Trump administration, eased under the Biden administration and have gone parabolic in 2025. References to reshoring/supply chain shifts (black line) have gradually risen since the late 2010s as companies increasingly consider reshoring critical functions to avoid tariffs and/or look for domestic input sources.

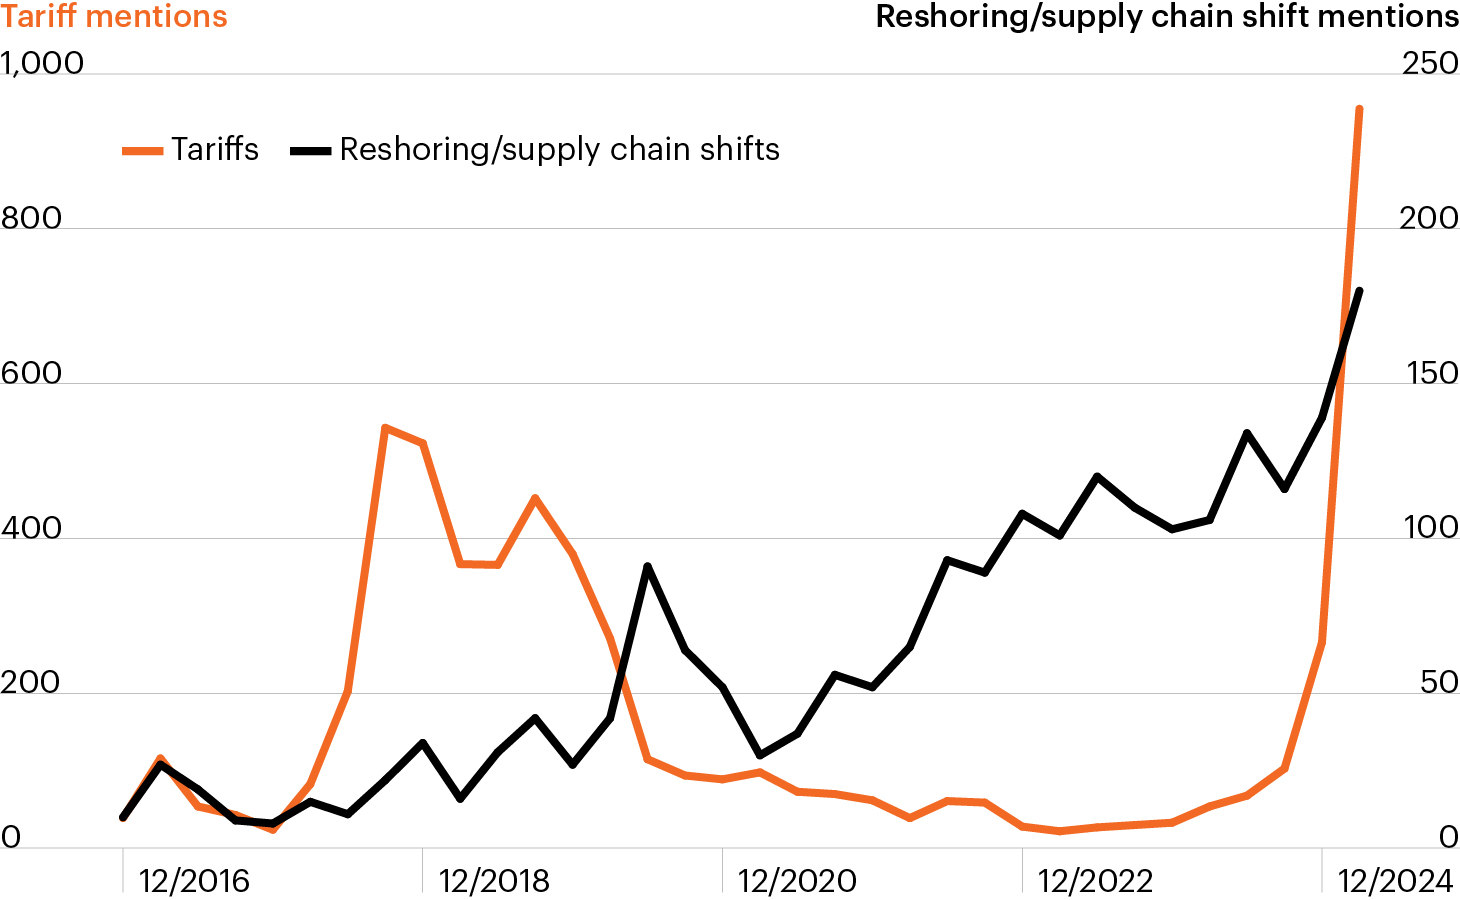
Source: Bloomberg Intelligence, L.P., as of March 26, 2025. 

  • Despite resilient economic data, continued uncertainty surrounding tariffs, monetary policy and economic growth again drove market volatility this week.
  • Mentions of tariffs during corporate earnings calls spiked during the first Trump administration, eased under Biden and have gone parabolic in 2025.1 Tariffs appear likely to be implemented much more broadly than in the late 2010s, leading to widespread impacts across industries.
  • Public markets sit at the epicenter of the potential financial fallout. Large multinational firms not only operate complex international supply chains, but also their global consumer bases (34% of S&P 500 revenues are sourced from abroad) are highly exposed to retaliatory trade measures.2
  • The U.S. middle market may represent a potential shelter from the macro volatility. The private companies that comprise the U.S. middle market tend to have simpler, more domestically focused supply chains than their S&P 500 counterparts, with an average of 84% of revenues generated in the U.S.2
  • The middle market also stands to benefit as companies increasingly consider reshoring critical functions to avoid tariffs and/or look for domestic input sources.

  • Bloomberg Intelligence, L.P., as of March 26, 2025, based on companies within the Russell 3000 Index.

  • Bloomberg Finance, L.P., U.S. BEA, FS Investments.

The chart of the week and any accompanying data is for informational purposes only and shall not be considered an investment recommendation or promotion of FS Investments or any FS Investments fund. The chart of the week is subject to change at any time based on market or other conditions, and FS Investments and FS Investment Solutions, LLC disclaim any responsibility to update such market commentary. The chart of the week should not be relied on as investment advice, and because investment decisions for the FS Investments funds are based on numerous factors, may not be relied on as an indication of the investment intent of any FS Investments fund. None of FS Investments, its funds, FS Investment Solutions, LLC or their respective affiliates can be held responsible for any direct or incidental loss incurred as a result of any reliance on the chart of the week or other opinions expressed therein. Any discussion of past performance should not be used as an indicator of future results.

This information is educational in nature and does not constitute a financial promotion, investment advice or an inducement or incitement to participate in any product, offering or investment. FS Investments is not adopting, making a recommendation for or endorsing any investment strategy or particular security. All views, opinions and positions expressed herein are that of the author and do not necessarily reflect the views, opinions or positions of FS Investments. All opinions are subject to change without notice, and you should always obtain current information and perform due diligence before participating in any investment. FS Investments does not provide legal or tax advice and the information herein should not be considered legal or tax advice. Tax laws and regulations are complex and subject to change, which can materially impact any investment result. FS Investments cannot guarantee that the information herein is accurate, complete, or timely. FS Investments makes no warranties with regard to such information or results obtained by its use, and disclaims any liability arising out of your use of, or any tax position taken in reliance on, such information.

Any projections, forecasts and estimates contained herein are based upon certain assumptions that the author considers reasonable. Projections are necessarily speculative in nature, and it can be expected that some or all of the assumptions underlying the projections will not materialize or will vary significantly from actual results. The inclusion of projections herein should not be regarded as a representation or guarantee regarding the reliability, accuracy or completeness of the information contained herein, and neither FS Investments nor the author are under any obligation to update or keep current such information.

All investing is subject to risk, including the possible loss of the money you invest.

Search our site