Inflation has accelerated fast and erupted from all major sectors
Inflation has dominated headlines throughout 2022 and with good reason. Inflation is at the epicenter of economic and policy uncertainty, and financial market volatility. Consumer price inflation has accelerated into midyear, at in June was 9.1% year over year, the highest since 1982.
High inflation is a result of a perfect storm of factors. Supply-chain disruptions continue to put upward pressure on durable goods prices, particularly automobile prices. The Russian invasion of Ukraine caused energy prices to soar and added to food price inflation. A labor shortage continues to cause wages to rise. Finally, rents have jumped 5.1% year over year, the highest since the early 1990s, a troubling. trend that could cause inflation expectations to become entrenched going forward.
Inflation may well peak in Q3 as base effects cause some deceleration, but we expect inflation to remain elevated and end the year at 5%–6% year over year, and to remain high well into 2023. This is far above the 2.1% average of the prior 25 years. Now is the time for investors to address the threat inflation poses to their portfolios.
A generation of investors has not had to manage through sustained inflation.
Source: Bureau of Labor Statistics, FS Investments, as of July 24, 2022.
Note on categories: Energy, food, owners’ equivalent rent and transportation services categories are all represented by their CPI defined subindices. Other categories combine subindices and apply CPI designated weights. Durable goods: Household furnishings, recreation, education & communication, transportation. Non-durables goods: Apparel, medical goods, alcoholic beverages, other goods. Other Services: Lodging away from home, tenants’ & household insurance, water & sewer collection, household operations, medical care services, recreation services, education & communication, other personal services. Categories are meant for illustrative purposes.
Inflation can become entrenched via the economy
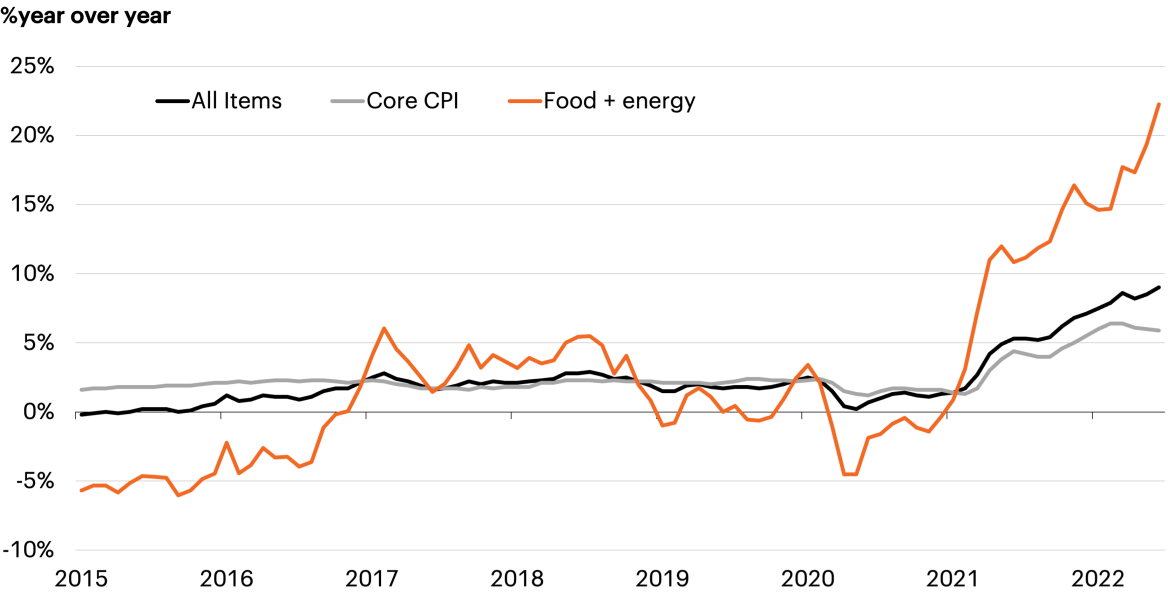
Food and energy impact all households
Source: Bureau of Labor Statistics, FS Investments, as of July 24, 2022.
Inflation has a powerful impact on the economy. Rising prices erode the purchasing power of households as real wages—nominal wages adjusted for inflation—have fallen -4.4% year over year. Russia’s invasion of the Ukraine in February caused food and energy prices to surge. Higher oil prices pushed gasoline prices over $5 per gallon, a 52% increase from the beginning of the year. Food price inflation has been troublesome since the pandemic began, beset by poor harvests, worker disruptions and higher transportation costs. The Russian invasion sent grain futures up and food inflation accelerated further. A blended food and energy price index, which accounts for a fifth of household inflation, hit a punitive 22% year over year in June, badly denting household budgets and crowding out other discretionary spending.
Source: Bureau of Labor Statistics, Federal Reserve Bank of Atlanta, as of July 24, 2022.
Rising rents have delivered another blow to households as rents—reflected by owners’ equivalent rent (OER) in the consumer price data—have accelerated sharply in the first half of 2022 to 5.5% year over year, the highest since the early 1990s. Policymakers have taken note as this has added to “sticky” inflation; categories that do not rapidly adjust lower (for example, most leases are signed for a year or more). An index of sticky-price inflation has risen to almost 4% and risks becoming increasingly entrenched in long-run inflation expectations. Household confidence has suffered under the heavy burden of higher inflation, and the University of Michigan survey of consumer sentiment hit its lowest reading on record in May 2022.
Fed policy response has stoked market volatility
Inflation has dominated headlines throughout 2022 and with good reason. Inflation is at the 2022 has seen the Fed embark on the most aggressive rate hike cycle since the 1980s after falling badly behind the curve as inflation accelerated in 2021. Since March, the Fed has raised rates 225 bps to 2.25%–2.50%. Markets expect at least a 50 bps rate hike at the September 21 meeting and are pricing about 100 bps more rate hikes total by end-2022.
Fed rate hike cycles are historically challenging times for markets, and this time volatility has been especially acute. Expectations have swung wildly as markets have pulled forward rate hikes and are already pricing in rate cuts in 2023. Historically, the Fed has a hard time managing a soft landing where they slow the economy but avoid a recession.
Concerns about slowing growth and recession are evident in low long-term interest rates. The 10-year yield has retreated to around 2.75% after rising as high as 3.50%, while short-term rates have risen sharply. This has caused the 3M-10Y spread to come close to inverting, often a precursor of recession. While inflation persists, income from traditional investments remains paltry. For investors, the income challenge will remain daunting.
This Fed rate hike cycle has been the most aggressive since the 1980s.
Source: Federal Reserve, NBER, Bloomberg Finance, L.P., as of July 25, 2022. Shaded areas represent NBER dated recessions.
Real yields remain deeply negative
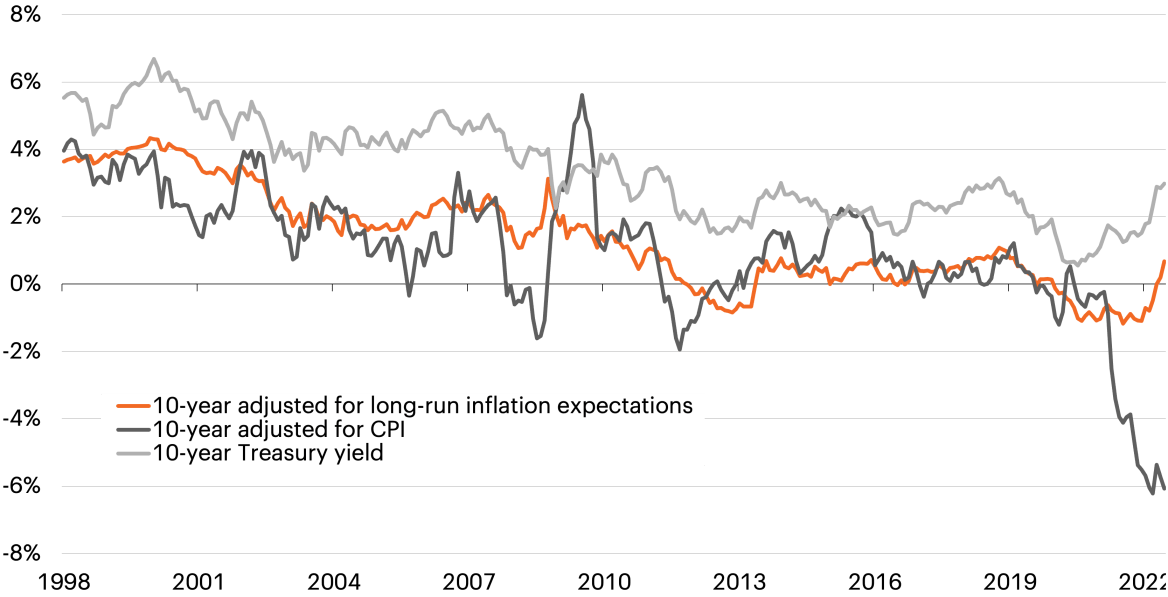
As the Fed has raised rates, long-run yields have also made a notable move higher, and the 10-year Treasury has risen from 1.51% at the start of the year to 3.01% at the end of June. Yet, if income looks more attractive now that nominal yields are modestly higher, that is not the full story. Inflation causes an obvious problem for traditional fixed income—yields are still close to historic lows, and when adjusted for inflation, the result is deeplynegative real interest rates. Back in 1982, when economic inflation was similar to current levels, the 10-year Treasury yield was 13%. In the decades that followed, income has been increasingly challenged after a 40-year decline in nominal interest rates, but price appreciation has handily compensated.
Now, the story is painfully different. The market often uses the yield of Treasury Inflation- Protected Securities (TIPS) as a proxy for real
interest rates. By this measure, real interest rates are around 50 bps. When adjusted for inflation today, however, the outcome is more damaging with deeply negative interest rates of almost— 600 bps. Investors could be facing negative real rates for some time, an environment that deserves consideration within a portfolio.
Real interest rates are in deeply negative territory and could remain there for some time.
10-year nominal and real interest rates
Source: Federal Reserve, Bloomberg Finance, L.P., FS Investments, as of July 25, 2022.
Note: Long-run inflation expectations are shown as 10-year TIPS yield.
Inflation spells trouble for the 60/40
History shows us that rather than the absolute level of inflation, both the magnitude and direction of inflation changes can impact forward-looking equity returns. As shown in the top left quadrant above, in an environment of inflation that is high and rising like today, the 12-month forward returns for the S&P 500 have historically been negative. The San Francisco Fed showed that a key macroeconomic variable that impacts cyclically adjusted price-to-earnings ratio (CAPE ratio) is inflation, with a statistically significant negative correlation. They ultimately concluded that “…stock investors fail to properly account for inflation in their present value calculations.”1 Finally, the prospect of Fed rate hikes has already injected significant volatility into equity markets.
Rising rents have delivered another blow to households as rents—reflected by owners’ equivalent rent (OER) in the consumer price data—have accelerated sharply in the first half of 2022 to 5.5% year over year, the highest since the early 1990s. Policymakers have taken note as this has added to “sticky” inflation; categories that do not rapidly adjust lower (for example, most leases are signed for a year or more). An index of sticky-price inflation has risen to almost 4% and risks becoming increasingly entrenched in long-run inflation expectations. Household confidence has suffered under the heavy burden of higher inflation, and the University of Michigan survey of consumer sentiment hit its lowest reading on record in May 2022.
Left: Source: Table based on CPI data from January 1988 to September 2021. Defines a “high” inflation level over 3.2% y/y (top quartile), “low” inflation of below 1.7% y/y (bottom quartile), and all other cases are “neutral.” An “increasing” environment reflects a greater than 0.9% level change in trailing 12-month CPI, a “decreasing” environment reflects a -0.8% decline in level CPI in the trailing 12-months. A “neutral” environment is all other cases. Nominal Total Return forward 12 months is the following 12-month performance of the S&P 500. As of October 21, 2021.
Right Source: Bureau of Labor Statistics, Federal Reserve Bank of Atlanta, as of July 24, 2022.
Implications for portfolio construction
As the Fed has raised rates, long-run yields have also made a notable move higher, and the 10-Not only does inflation impact both equity and bond returns, it also impacts the relationship between the two. This universal standard, balanced portfolio has long been built on the premise that stocks and bonds are negatively correlated: Bonds hedge stocks in their decline and act as a portfolio ballast. This relationship served investors well for the better part of this century but has failed this year as both stocks and bonds have declined in unison, with the 60/40 suffering its worst start to a year in history.
Looking back over history shows that the correlation between stocks and bonds has actually been positive more than it has been negative. And this positive correlation coincides with periods of elevated inflation. Inflation has come for the 60/40 portfolio. Now investors need alternative sources of diversification. We believe well designed absolute return liquid alternatives can be an attractive option in today’s environment. When executed correctly, these strategies should have little correlation and beta to both equity and bond markets, low standard deviation, low maximum drawdowns and steady returns.
Inflation has come for the 60/40. Investors need new sources of diversification. Liquid alternatives may help.
Source: Bureau of Economic Analysis, Bloomberg Finance, L.P., FS Investments, as of May 31, 2022.
Where should investors go?
Not only does inflation impact both equity and bond returns, it also impacts the relationship between the two. This universal standard, balanced portfolio has long been built on the premise that stocks and bonds are negatively correlated: Bonds hedge stocks in their decline and act as a portfolio ballast. This relationship served investors well for the better part of this century but has failed this year as both stocks and bonds have declined in unison, with the 60/40 suffering its worst start to a year in history.
Looking back over history shows that the correlation between stocks and bonds has actually been positive more than it has been negative. And this positive correlation coincides with periods of elevated inflation. Inflation has come for the 60/40 portfolio. Now investors need alternative sources of diversification. We believe well designed absolute return liquid alternatives can be an attractive option in today’s environment. When executed correctly, these strategies should have little correlation and beta to both equity and bond markets, low standard deviation, low maximum drawdowns and steady returns.
Equity sector earnings beta to GDP

Source: Bloomberg Finance, LP, FS Investments, as of December 31, 2021. Beta to GDP is the beta of % y/y sector revenue growth to % y/y U.S. nominal GDP growth.
Credit markets weather inflation well
With inflation attacking core fixed income portfolios, it may be time for investors to rethink this allocation. Despite a rough start to 2022 for parts of the market, we continue to believe that sub-investment grade credit deserves a long-term allocation in many diversified portfolios. Credit markets have historically been resilient following periods of weakness and over the long term, and both senior secured loans and high yield bonds have had higher Sharpe ratios than the S&P 500.
In an environment of elevated inflation, defaults are often cited as a concern given possible margin compression as prices rise, but this concern is unwarranted. Historically, the most benign default environments have coincided with periods of elevated inflation. Statistically, there is an inverse relationship between defaults and inflation. Currently, credit still enjoys a solid fundamental backdrop: Margins are strong, and earnings have surpassed pre-COVID levels. Still, we believe that inflation and the potential for a slowing economy will create winners and losers at the company and sector levels, necessitating an active and flexible approach to credit investing.
Credit markets have historically weathered inflationary pressures well, while continuing to provide above market income.
Credit market defaults vs. inflation

Source JP Morgan, Bureau of Labor Statistics, FS Investments. December 1998–June 2022.
Real assets: The tried & true inflation hedge
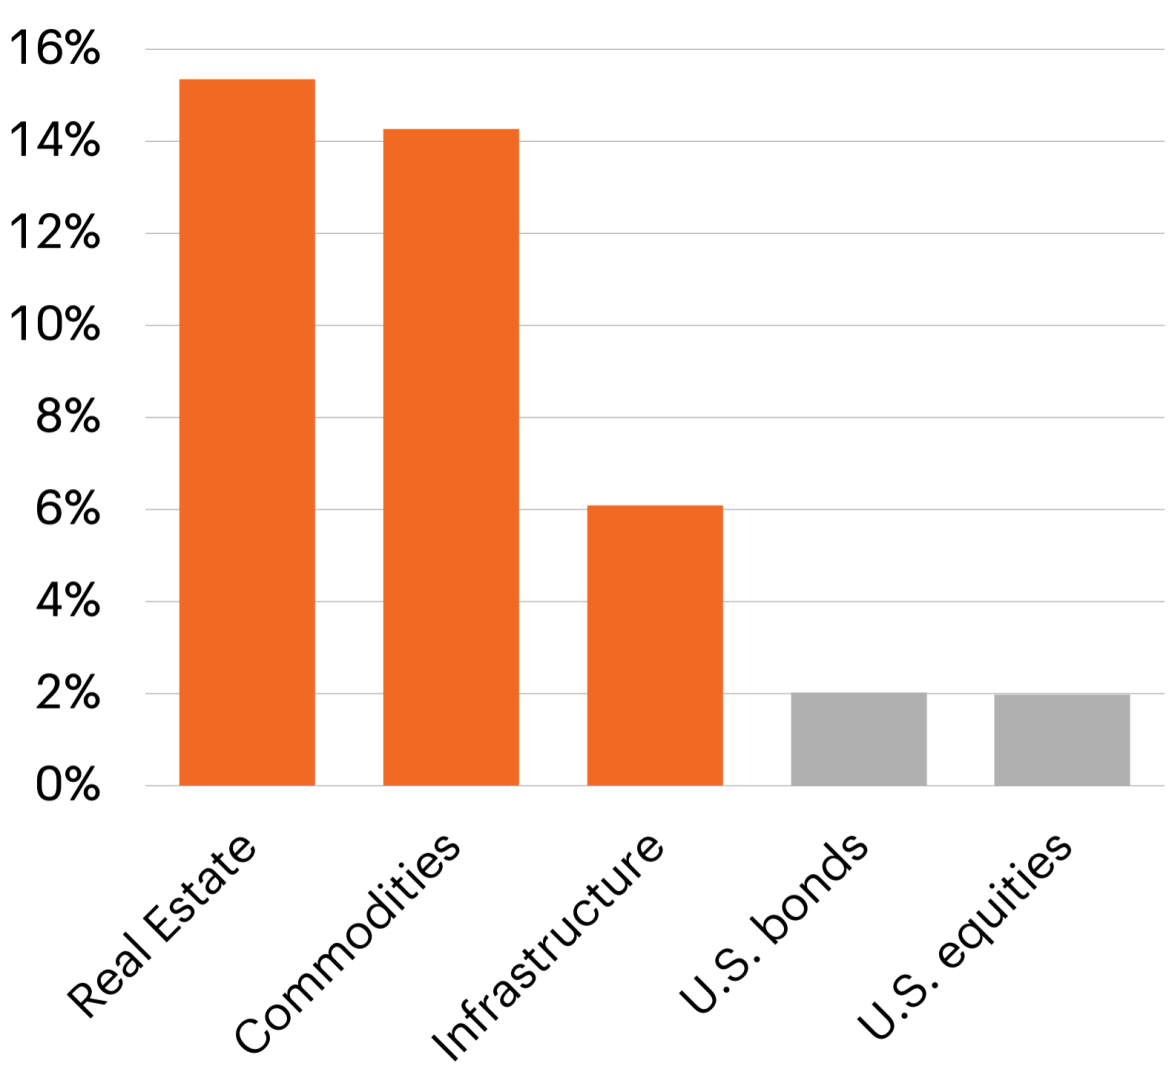
Real assets have shown high sensitivity to changes in inflation

Source: Bloomberg Finance, LP, FS Investments. December 31, 1978–December 31, 2021.
Beta of index returns to change in Consumer Price Index (CPI).
Real assets are often considered the primary bulwark to defend against inflation, and with good reason. Traditional real assets are typically divided into commodities, infrastructure, real estate and natural resources. Over time returns of these sub-groups have been highly sensitive to change in inflation as reflected in the betas of various real asset classes to changes in CPI.
But what really drives this inflation sensitivity? Infrastructure and real estate assets often have an explicit link to inflation as rents, tolls and other sources of contractual revenue may be indexed to or increase in proportion with rising inflation. Utility companies and other infrastructure assets are often monopolistic with high barriers to entry and therefore enjoy strong pricing power.
Which has led to outperformance vs. traditional stocks & bonds during periods of rising inflation
Source: Bloomberg Finance, LP, FS Investments. December 31, 2002-June 30, 2022.
Rising periods of inflation include all periods when CPI rose above the mean by one standard deviation or more.
Midstream energy assets such as pipelines are long-lived assets that generate cash flows which typically include inflation escalators. As inflationary pressures increase, commodity and natural resource prices tend to rise since they are inputs into creating goods and services. This high degree of inflation sensitivity has resulted in strong outperformance versus a traditional portfolio of stocks and bonds during periods of rising prices. After 40 years of muted inflation, portfolios are likely underprepared for high inflation and underexposed to real assets. We believe a well diversified portfolio in today’s environment includes an allocation to these proven inflation hedges.