
Ask an investor what’s on their wish list these days, and they will likely tell you an investment with moderate to high returns that is also liquid (in case they want to reverse their decision or need the money quickly), with low volatility and low risk, as well as low cost.
All I can say is, “Sign me up!”
Despite this set of unrealistically high demands, the U.S. stock market has done a reasonably good job of delivering on them, at least recently: A $1 investment in 2009 would be worth over $3 today.¹ Not bad at all.
But what will returns from a diversified portfolio of stocks look like going forward?
Predicting equity market returns
Predicting equity market returns is almost an impossible task given you must predict the momentum-driven behavior of collective market participants. As Benjamin Graham once said, “In the short run, the market is a voting machine.”
Having said that, we all need to make an educated forecast at some point, so how do you do so? One approach could be to use simple historical averages of realized market returns to predict future returns. While fairly straightforward, this approach can be a trap for both individual and institutional investors. Human behavior is prone to what psychologists call a “recency effect,” in which we tend to extrapolate the most recent past as what to expect in the future.
A second approach would be to apply a more rigorous framework to forecast the direction and magnitude of equity market returns. So, what drives equity returns anyway?
There are three basic “building blocks” of equity market returns: dividend yields, earnings growth and changes in price-to-earnings (P/E) multiples.
- Dividend yields: This metric indicates how much a company pays out each year in dividends, which are the only cash flows that are paid out to long-term equity investors.
- Earnings growth: This rate indicates how much the bottom line of a company is growing each year. The rate is typically calculated on a real (or without inflation) basis. Future inflation expectations are then added back to arrive at a nominal growth rate number.
- Change in P/E multiples: A P/E multiple indicates the price that an investor is willing to pay for $1 of earnings. Historically, this multiple for the U.S. market overall has averaged 18x but it varies considerably over time and is influenced by factors such as interest rates and inflation.2 When interest rates and inflation are low, P/E multiples tend to be high, and vice versa. One important item of note is that P/E multiples are inversely correlated with future expected returns over the long term: high P/E multiples portend low future returns while low P/E multiples portend high future returns.
Stock market returns: a look back
Let’s take a look at stock returns from 1982–2016. Over this period, U.S. equity returns averaged 11.5%.³ Using the approach of basing future returns on historical averages, we would assume that we should be able to generate approximately 11% in a diversified portfolio of stocks going forward.
Now, let’s break down how these historical returns were generated using the three building blocks:
During this time frame:
- Dividend yields accounted for 2.6% of the annual returns.
- Nominal earnings over this investment horizon posted 5.8% returns. Keep in mind, inflation over this period added 2.8%4 annually.
- Finally, changes in P/E multiples added 2.7% to the historical average returns.5
In hindsight, one critical advantage of investing over this period was that the P/E multiple in 1982 averaged 7.9x. In other words, you were investing less than $8 for a claim on $1 of earnings.
Stock market returns today
Today, the conditions are dramatically different. Let’s look at the three building blocks:
- The dividend yield is easily observed in the market and today stands at 2.0%, compared to 2.6% in the previous period.6
- Earnings growth in the short run is highly volatile. However, over the long term it is far more forecastable. And barring dramatic regulatory reform, given demographic and productivity trends, U.S. economic growth is forecast to grow close to 2% for the foreseeable future.7
Over the long run, companies’ earnings growth cannot outpace the economy in which they operate. Given that GDP growth is adjusted for inflation, real earnings growth of 2.0% can reasonably be implied. To arrive at a nominal earnings growth, we add back expected inflation. The 5-year breakeven inflation rate (difference between real and nominal government bond yields) today is 1.6%,8 which gives us a nominal expected earnings growth rate of 3.6%, as compared to 5.8% in the previous period. - The expected change in market multiple is the most difficult to forecast given it estimates what investors will be willing to pay for stocks in the future. The long-term average multiple is 18x and is historically mean-reverting. Remember that 8x multiple from January of 1982? Today, that same multiple is over 21x – an investor is paying $21 for $1 of earnings in the equity markets today. This level of P/E multiples is in the top decile of historical valuations. We might as well face it, stocks as an asset class are richly valued today. Many forecasters expect these market multiples to contract toward the long-term average in the coming years as rates and inflation move higher. However, another argument can be made that rates will remain low, thus justifying the high level of multiples. Either way, while there is potential for significant downside, it is difficult to foresee multiples expanding further from here. Let’s leave it as a push and add no positive or negative contribution from changes in multiples in the future.
Contributions to equity returns
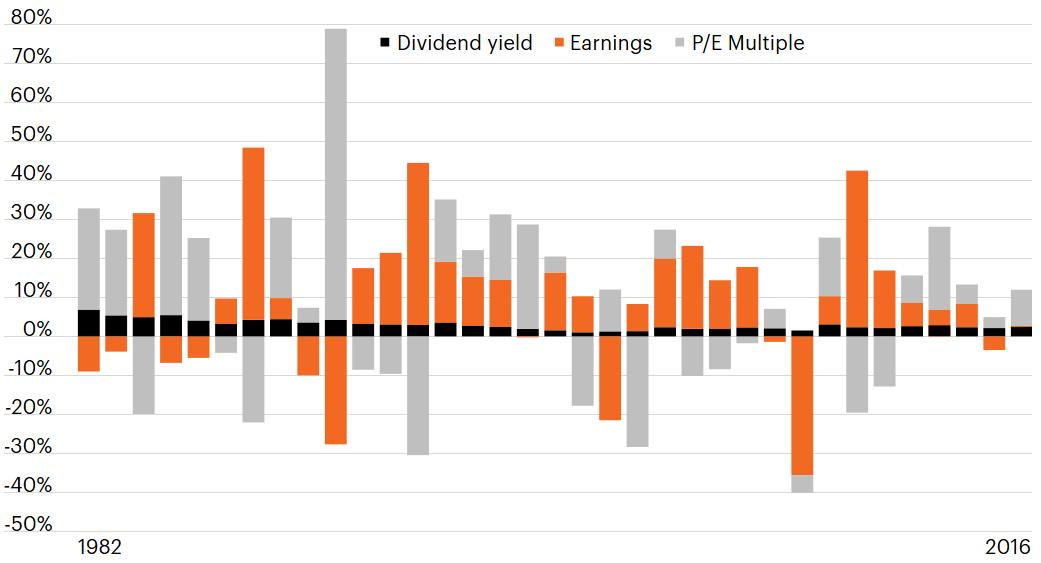
Source: Bloomberg.
Put it all together, and these building blocks produce an expected annualized return of 5.6% over the next 5 years. If you are in the camp that believes stocks will revert to long-term average multiples over this time frame, the expected returns drop by 2.4% annually.
When you incorporate this forecast into a 60/40 portfolio of stocks and high quality bonds, which yield roughly 2.6% today,⁹ the expected total return of such a portfolio at 4.5% is near the lowest future expected returns of the past century.
Beware the impact of quantitative tightening
I should point out an additional critical driver of equity returns: central bank liquidity. Since the great financial crisis of 2008, the U.S. Fed has taken interest rates to the basement using what has become (in)famously known as “zero interest rate policy,” or ZIRP, while quadrupling the central bank balance sheet to $4.5 trillion over 6 years with another policy known as “quantitative easing,” or QE. These policies drove companies to repurchase $3.4 trillion dollars of stock10 since the crisis, all of which has driven equity prices to all-time highs. Today, that same Fed is hiking interest rates, reversing QE (now being renamed “quantitative tightening”), and stock buybacks have begun slowing down considerably. Following actions that have financially engineered one of the great bull market cycles of the past 100 years, stock market tailwinds have quickly turned to headwinds.
Investing in a changing market
It is sometimes easy to forget that the last 8 years of rising equity markets began following a negative 38% year. There is simply no such thing as “easy money.” So, what should investors do?
- Accept lower returns and adjust their lifestyles to fit the lower-return environment. As future returns will likely be lower than our most recent past, saving more money is the only surefire way to increase your portfolio’s value in the long run.
- Accept higher risk. The corollary to the above point, invested capital can only generate higher expected returns if the investor is willing to accept higher risk and the possibility of higher losses.
- Find alternative sources of return. Incorporating strategies that produce income or growth from investments in addition to traditional stocks and bonds may enhance returns while diversifying portfolio risk.
We can’t predict the future – no one can. The future of equity market returns is not likely to be as good as they have been in the recent past. The conditions have changed and investors must plan appropriately.