Chart of the week

S&P 500 Index experienced zero moves of 1% or more in 2017

As 2017 came to a close, the S&P 500 Index continued its progress on what has been an unprecedented run.

January 5, 2018 | 2 minute read
Chart comparing number of days S&P 500 experiences 0 moves of 1% or more in 2017
  • As 2017 came to a close, the S&P 500 Index continued its progress on what has been an unprecedented run. December 31, 2017 marked its 14th consecutive month of positive returns.1 Never before has the S&P 500 Index generated positive monthly returns for so long a period.1 In fact, its last negative monthly return came in October 2016, when it returned approximately -1.8%.1
  • However, there is a strong relationship between equity valuations and forward returns. Periods of high equity valuations have historically been followed by relatively low future returns, and the inverse is true for periods of low equity valuations.
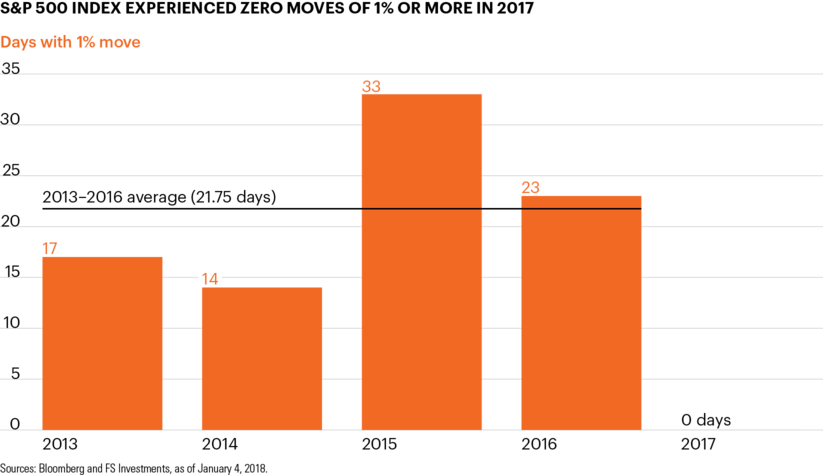
  • The recent string of positive equity returns has been even more remarkable because it has come amid historically low levels of volatility.
  • For example, the S&P 500 Index did not experience a single move, up or down, of 1% or more in 2017. It averaged almost 22 such days in each of the previous four years.2 Using another indicator, the CBOE Volatility Index, which measures market expectations and near-term equity volatility, averaged just 11.1 for the year and spent much of 2017 below 10.3 For context, this was far below the index’s historical average of approximately 19.1.3
  • While no one knows for certain what the future holds for stock market performance, investors might be wise to watch market conditions should volatility once again enter the markets in 2018.

  • Bloomberg based on total returns for the S&P 500 Index.

  • Bloomberg and FS Investments, as of January 4, 2018.

  • CBOE, http://bit.ly/2lSZupx. Historical average between January 2004 and December 2016.

The chart of the week and any accompanying data is for informational purposes only and shall not be considered an investment recommendation or promotion of FS Investments or any FS Investments fund. The chart of the week is subject to change at any time based on market or other conditions, and FS Investments and FS Investment Solutions, LLC disclaim any responsibility to update such market commentary. The chart of the week should not be relied on as investment advice, and because investment decisions for the FS Investments funds are based on numerous factors, may not be relied on as an indication of the investment intent of any FS Investments fund. None of FS Investments, its funds, FS Investment Solutions, LLC or their respective affiliates can be held responsible for any direct or incidental loss incurred as a result of any reliance on the chart of the week or other opinions expressed therein. Any discussion of past performance should not be used as an indicator of future results.

This information is educational in nature and does not constitute a financial promotion, investment advice or an inducement or incitement to participate in any product, offering or investment. FS Investments is not adopting, making a recommendation for or endorsing any investment strategy or particular security. All views, opinions and positions expressed herein are that of the author and do not necessarily reflect the views, opinions or positions of FS Investments. All opinions are subject to change without notice, and you should always obtain current information and perform due diligence before participating in any investment. FS Investments does not provide legal or tax advice and the information herein should not be considered legal or tax advice. Tax laws and regulations are complex and subject to change, which can materially impact any investment result. FS Investments cannot guarantee that the information herein is accurate, complete, or timely. FS Investments makes no warranties with regard to such information or results obtained by its use, and disclaims any liability arising out of your use of, or any tax position taken in reliance on, such information.

Any projections, forecasts and estimates contained herein are based upon certain assumptions that the author considers reasonable. Projections are necessarily speculative in nature, and it can be expected that some or all of the assumptions underlying the projections will not materialize or will vary significantly from actual results. The inclusion of projections herein should not be regarded as a representation or guarantee regarding the reliability, accuracy or completeness of the information contained herein, and neither FS Investments nor the author are under any obligation to update or keep current such information.

All investing is subject to risk, including the possible loss of the money you invest.

Search our site