Share buybacks have been front and center in the news after a record-breaking pace in 2018. Proponents argue this represents a prudent use of capital, while opponents brand buybacks as the latest example of corporate short-termism siphoning resources from the economy. We take a look at why companies buy back shares, the legitimacy of the concerns presented by those opposed, and how buybacks impact the investing landscape.
Buyback to basics
S&P 500 buybacks hit a record $806 billion in 2018, a 55% increase from the year prior, capturing the attention of investors, the media and political figures. Put another way, buybacks took 3.3% of the index market capitalization¹ out of the public market in just one year. Figure 1 shows that while buyback value has picked up significantly, as a percentage of the market it continues to largely be in line with activity seen during this expansion. Nevertheless, buybacks during this cycle have significantly outpaced those of the previous cycle.

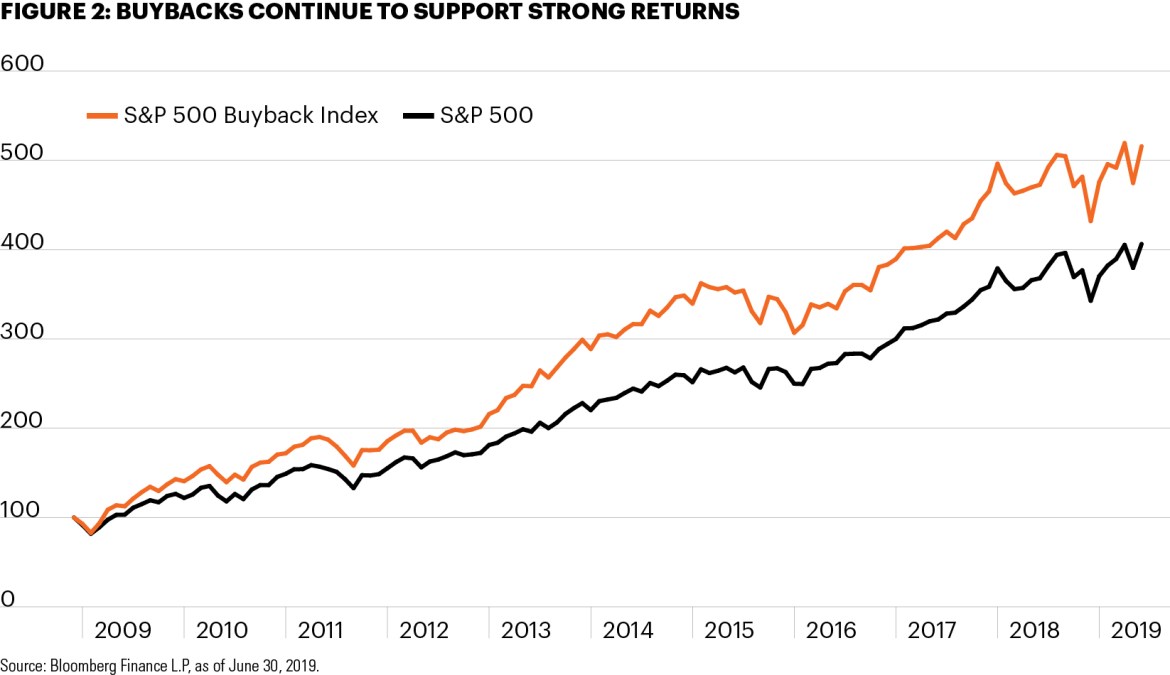
With buybacks clearly elevated during this decade-long bull run, the next question would be whether this has impacted equity share prices. Hypothetically, by reducing the number of shares outstanding, a company engaging in buybacks should see its stock price rise, as each share now equates to a higher percentage of ownership in the company. Figure 2 shows the market has indeed rewarded companies who repurchase relatively more shares, with the S&P 500 Buyback Index outperforming the larger benchmark by 110 percentage points since 2009.

There are three chief motives for firms to repurchase their own shares. First, some companies may simply see it as a better way to return value to shareholders. Buybacks act as an alternative to dividends in rewarding investors. Instead of paying out cash dividends, firms repurchase shares on the open market, resulting in investors receiving cash for the shares bought back while retaining their total share of equity in the company. Buybacks tend to be more unpredictable than dividends, giving companies more flexibility to adjust how much they pay out to investors. Indeed, most buyback activity occurs in the U.S., where dividend yields are lower than much of the developed world.
Second, companies are carrying more cash on their balance sheets than previously. In 2000, cash and equivalents accounted for 5.8% of total assets in the S&P 500. That has more than doubled to a high of 12.1% in 2017.² Companies can generally do three things with cash on hand: return it to shareholders (via dividends or buybacks), pay down debt or invest it. Buybacks may be a sign companies are not seeing enough attractive returns to justify investing.
Third, buybacks are a lever that management teams can pull to inflate stock prices. Companies know buybacks tend to increase stock price returns in the short term, and management compensation is commonly tied to stock prices or earnings per share (EPS). A cynic would argue executives are incentivized to engage in buybacks to inflate share price and EPS, even if only in the short term, in order to increase their annual payout.
Why the kerfuffle?
Corporate balance sheet activity generally doesn’t make a particularly compelling news story. So why are buybacks getting so much airtime? Opponents often argue that buybacks are the embodiment of a growing corporate short-termism that prizes near-term profits over long-term economic growth. We analyze two consistent criticisms: that companies are repurchasing shares instead of investing for growth, and that companies are taking on excess debt in order to finance repurchases.
1. Firms are opting for buybacks in lieu of growth expenditures. Critics say firms are choosing to prioritize a bump in near-term EPS and stock price rather than invest for long-term growth in the form of capital spending. Figure 3 shows capital expenditures as a percentage of total business internal funds (essentially operating cash flow). This data shows a moderating of capex activity since a peak in 2002.

While this decline does coincide with an uptick in buybacks, we can’t definitively say buybacks are the root cause. The economy has changed rapidly over the past two decades, and investments in software and research and development (R&D) gained in importance. Under GAAP rules, these intangible items are expensed on the income statement rather than capitalized on the balance sheet and, therefore, are not included in the capex data. Since 2002, software and R&D have risen from 23.8% of total nonresidential private investment to 32.0%, meaning capex growth may not tell the entire investment story. The bottom line as to whether buybacks have slowed down business investment: It’s complicated.
2. Firms are taking on excess debt to buy back shares: While debt-fueled buybacks certainly occur and would be considered imprudent in most cases, this does not appear to be a widespread issue. Figure 4 shows current debt/asset ratios are well below levels from the previous two decades, indicating firm leverage has actually decreased over the time period that buybacks increased. The critique is likely brought on by the fact that the total dollar amount of corporate debt has continued to reach new records during this expansion.

In summary, share buyback levels may be having some impact on firms’ ability to invest in growth projects, though it is difficult to say for sure. With software and R&D becoming more prominent parts of expenditures, we may need to rethink how we look at capital investment. Additionally, buybacks do not appear to be destroying balance sheets. In fact, debt levels are lower now than they were in the 1990s.
Buybacks erode the landscape for retail investors
For investors, the result of extended buyback activity is the de-equitization of public markets. As Figure 5 shows, share retirements (which include both buybacks and shares retired via mergers & acquisitions) have consistently outpaced new share issuance since 1996. This has resulted in $6.5 trillion of market cap being taken out of the U.S. public equity markets over the past 22 years.

The upward trend in share repurchases has coincided with a broad decline in the count of public companies in the United States. The number of firms listed on an exchange in the U.S. peaked at more than 8,000 in 1996. By the end of 2018, that number had been nearly halved to about 4,400.³ This can be attributed to myriad factors, including the abundance of private capital, the regulatory and disclosure benefits of remaining private, and the fact that smaller start-ups are less profitable than they used to be.
The result of buyback activity and the decline of public firms is a public equity market that is both less diversified and more limited in gaining exposure to the broader U.S. economy. Correlations between sectors have risen over the past few decades, which can significantly impact an investor’s ability to build a sufficiently diverse portfolio.
The increase in the amount and availability of private capital has been a central driver of the de-equitization of the public markets. Over the past decade, capital has poured into private equity as well as private debt, infrastructure and real estate. Investors, especially large institutions, have decided public markets do not offer sufficient diversification and/or an attractive enough return profile to meet their needs, and thus have turned to private markets. Since 2003, private equity assets under management have more than quintupled, from $656 billion to nearly $3.6 trillion.⁴ Conversely, the market cap of all public U.S. equities has merely doubled over that time span.
Looking ahead: Buybacks’ impact on investors is real and significant
Looking ahead, buybacks figure to remain in the news and could even become a theme in the 2020 presidential election. While repurchase levels are likely to remain significant, it appears that the 2017 tax bill, which helped spur a surge in buyback activity, may represent a peak, at least for now. A slowdown in repurchases would remove a key support for equities, which have had such stellar returns since 2009, and could pressure valuations during a period when companies are facing mounting uncertainty.
Longer term, the trend’s effect on the investment landscape is real and significant. Buybacks, along with the decline in the number of public firms, have delivered investors an equity market that is less diversified and less representative of broad economic activity than before. More capital is chasing fewer and fewer shares in the public space. Institutions have understood this and piled into private alternative strategies. Retail investors, who have been treated to a stellar public equity market this decade, may also need to look elsewhere for diversification and return in the future.


