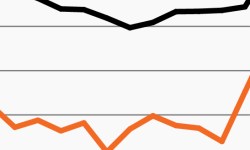
2023 has seen an extraordinarily concentrated rally
Stocks have rallied in 2023. But this week’s chart looks at the massive divide between returns on the Big 6 tech stocks and the rest of the S&P 500.
Credit performed well after previous Fed pauses
With the Fed potentially pausing after a May rate hike, this week’s chart looks at credit returns after historical pauses in Fed rate hiking cycles.

Stocks trapped in (an expensive) trading range?
Stocks have spent the last year range-bound. This week’s chart looks at the challenges they may face moving materially higher.
Family offices to increase allocation to alternatives
This week’s chart looks at institution’s growing interest in alts; they expect to grow allocations to real estate, private debt and private equity.

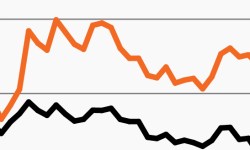
As rates reverse, a growth renaissance?
As rates plunged in March, growth stocks spiked. This week’s chart looks at the ever-shifting changing growth-value dynamics in recent years.
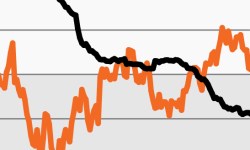
Higher credit spreads could represent unique opportunity
High yield spreads have spiked in March. This week’s chart looks at the YTD move and potential new opportunities in credit.