$5 trillion later, long-run GDP expectations mostly unchanged
Despite today’s optimism, long-run GDP projections remain similar to those pre-COVID. Our chart sounds a cautious note for long-term investors.

Flexibility important as 2020 leaders become laggards
Stock market leadership YTD has been a mirror image of 2020. Our chart looks this year’s leaders and why active management remains important.

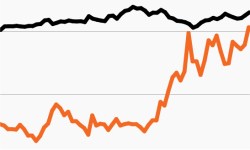
Stocks’ path higher in 2021 has been rocky
Equities’ rise this year has been choppy as investors confront new challenges. Our chart looks at stocks’ path and why flexibility remains important.

Rising inflation expectations ripple across the markets
Rates and inflation expectations moved higher this week. Our chart looks at why the Fed isn’t concerned, but markets could remain choppy, nonetheless.
Leveraged credit climbs amid rising rate environments
As Treasury yields jump, flexibility is key. This week’s chart looks at historical returns for credit when yields have risen quickly.

Flexibility paramount amid value-growth transition
Value stocks are showing signs of life as rates rise. This week’s chart looks at the change and suggests flexible mandates are more important than ever.
