Chart of the week

Bond market signals caution as equities steadily rise

Correlation between stock returns and bond yields has declined considerably. See what this could mean for forward-looking returns.

May 17, 2019 | 1 minute read
S&P 500 Index vs. 10-year U.S. Treasury yield
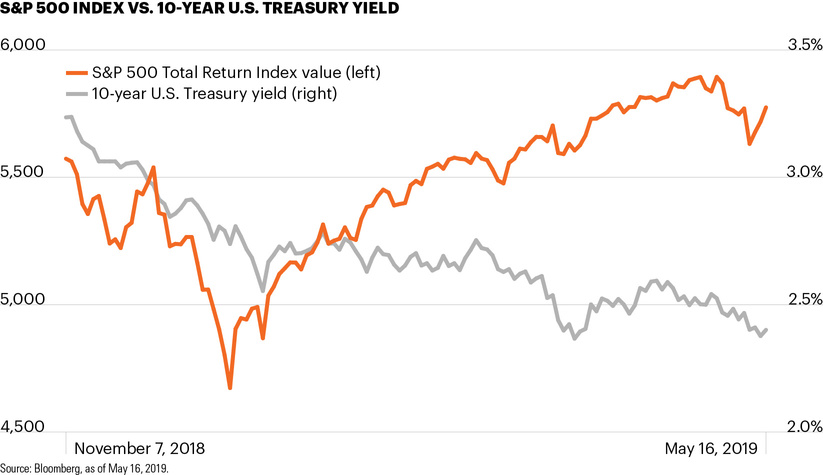
  • Amid the volatility experienced in Q4 2018, the performance of equity and fixed income markets reflected rising investor risk aversion as equities sold off and Treasuries rallied.
  • So far in 2019, however, equity and fixed income performance tell a tale of diverging market views. While the S&P 500 has recovered all of its Q4 decline, bond markets reflect a more cautious outlook.
  • Prior to the May pullback in the equity markets, the S&P 500 returned 18.2% through April 30. Even with the May decline, the S&P 500 has returned 15.6% year to date amid generally positive employment data and a strong, yet cautious, consumer.1
  • Meanwhile, government bond yields have steadily declined in 2019 and this week nearly touched their March lows. In fact, the 3M-10Y Treasury yield curve briefly inverted this week for the second time since March as demand for safe-haven assets drove down the yield of the 10-year Treasury.2
  • Fresh tariffs and a breakdown of trade negotiations injected a fresh bout of volatility into the markets this month amid a year in which volatility has otherwise been low. As the U.S. economic expansion ages and policy uncertainty remains, equity and fixed income markets may reflect differing outlooks – yet all investors would be wise to prepare for periods of uncertainty and the volatility they often create.

  • As of May 17, 2019.

  • Bloomberg, as of May 16, 2019.

The chart of the week and any accompanying data is for informational purposes only and shall not be considered an investment recommendation or promotion of FS Investments or any FS Investments fund. The chart of the week is subject to change at any time based on market or other conditions, and FS Investments and FS Investment Solutions, LLC disclaim any responsibility to update such market commentary. The chart of the week should not be relied on as investment advice, and because investment decisions for the FS Investments funds are based on numerous factors, may not be relied on as an indication of the investment intent of any FS Investments fund. None of FS Investments, its funds, FS Investment Solutions, LLC or their respective affiliates can be held responsible for any direct or incidental loss incurred as a result of any reliance on the chart of the week or other opinions expressed therein. Any discussion of past performance should not be used as an indicator of future results.

This information is educational in nature and does not constitute a financial promotion, investment advice or an inducement or incitement to participate in any product, offering or investment. FS Investments is not adopting, making a recommendation for or endorsing any investment strategy or particular security. All views, opinions and positions expressed herein are that of the author and do not necessarily reflect the views, opinions or positions of FS Investments. All opinions are subject to change without notice, and you should always obtain current information and perform due diligence before participating in any investment. FS Investments does not provide legal or tax advice and the information herein should not be considered legal or tax advice. Tax laws and regulations are complex and subject to change, which can materially impact any investment result. FS Investments cannot guarantee that the information herein is accurate, complete, or timely. FS Investments makes no warranties with regard to such information or results obtained by its use, and disclaims any liability arising out of your use of, or any tax position taken in reliance on, such information.

Any projections, forecasts and estimates contained herein are based upon certain assumptions that the author considers reasonable. Projections are necessarily speculative in nature, and it can be expected that some or all of the assumptions underlying the projections will not materialize or will vary significantly from actual results. The inclusion of projections herein should not be regarded as a representation or guarantee regarding the reliability, accuracy or completeness of the information contained herein, and neither FS Investments nor the author are under any obligation to update or keep current such information.

All investing is subject to risk, including the possible loss of the money you invest.

Search our site