Chart of the week

U.S. middle market: At the sweet spot of private equity

Private equity fundraising has far outpaced transaction volume among large-cap sponsors, while the middle market has been more closely aligned to the opportunity set, leading to more attractive valuations.

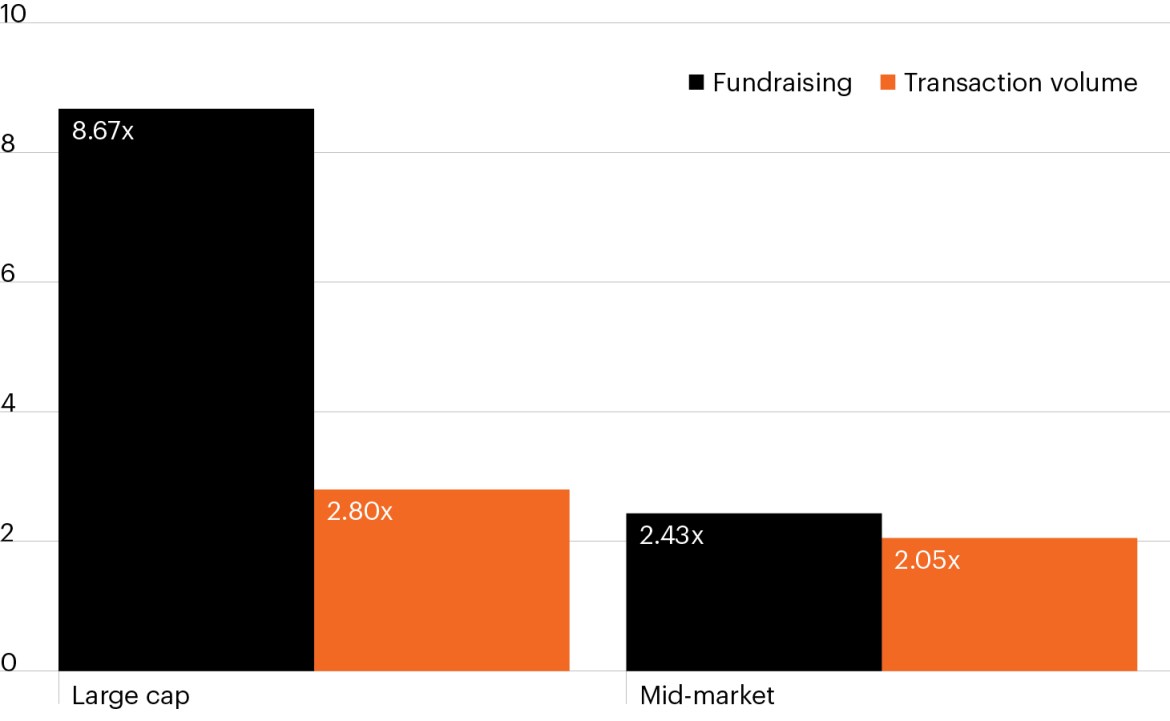
Growth in fundraising and transaction volume: 2011 to 2023

Column chart depicting fundraising and transaction volume for large-cap and mid-market private equity sponsors. The chart highlights that fundraising far outpaces transaction volume among large-cap sponsors. Within middle market PE deals, fundraising is much more closely aligned with transaction volume, leading to more attractive valuations within the middle market.

Source: Pitchbook, FS Investments, as of December 31, 2023.

  • Private equity fundraising has seen enormous growth in recent years, driven by its historical outperformance versus public equities along with growing retail interest. Private equity assets under management grew 172% for the six-year period ended December 2023 while dry powder—capital that has been raised but not yet deployed—grew 59%.1
  • Much of the fundraising has centered on large- and mega-cap PE sponsors. Yet the tremendous growth also has posed a unique problem for them: the capital raise has massively outpaced transaction volume.
  • From 2011 to 2023, the growth in large cap fundraising outpaced actual transaction volume by more than 580%.2 Meanwhile, fundraising among middle market PE sponsors has been much more closely aligned with their target opportunity set.
  • Significantly more money chasing large- and mega-cap deals has led to notably higher multiples (17.3x) there than in the mid-market space (14.4x).2
  • Large- and mega-cap PE sponsors garner most of the headlines and continue to lead fundraising efforts in 2024. Yet the U.S. middle market presents a deeper opportunity set comprised of more than 200,000 businesses and may offer a more attractive long-term growth opportunity than that of its large cap peers.

  • Preqin, as of December 31, 2024.

  • Pitchbook, FS Investments, as of December 31, 2023. Multiples represented by North American and European PE buyout enterprise value/EBITDA. Large- and mega-cap multiples represent averages for transactions of $1 billion or more. Mid-Market represent averages for transactions between $100 million and $1 billion.

The chart of the week and any accompanying data is for informational purposes only and shall not be considered an investment recommendation or promotion of FS Investments or any FS Investments fund. The chart of the week is subject to change at any time based on market or other conditions, and FS Investments and FS Investment Solutions, LLC disclaim any responsibility to update such market commentary. The chart of the week should not be relied on as investment advice, and because investment decisions for the FS Investments funds are based on numerous factors, may not be relied on as an indication of the investment intent of any FS Investments fund. None of FS Investments, its funds, FS Investment Solutions, LLC or their respective affiliates can be held responsible for any direct or incidental loss incurred as a result of any reliance on the chart of the week or other opinions expressed therein. Any discussion of past performance should not be used as an indicator of future results.

This information is educational in nature and does not constitute a financial promotion, investment advice or an inducement or incitement to participate in any product, offering or investment. FS Investments is not adopting, making a recommendation for or endorsing any investment strategy or particular security. All views, opinions and positions expressed herein are that of the author and do not necessarily reflect the views, opinions or positions of FS Investments. All opinions are subject to change without notice, and you should always obtain current information and perform due diligence before participating in any investment. FS Investments does not provide legal or tax advice and the information herein should not be considered legal or tax advice. Tax laws and regulations are complex and subject to change, which can materially impact any investment result. FS Investments cannot guarantee that the information herein is accurate, complete, or timely. FS Investments makes no warranties with regard to such information or results obtained by its use, and disclaims any liability arising out of your use of, or any tax position taken in reliance on, such information.

Any projections, forecasts and estimates contained herein are based upon certain assumptions that the author considers reasonable. Projections are necessarily speculative in nature, and it can be expected that some or all of the assumptions underlying the projections will not materialize or will vary significantly from actual results. The inclusion of projections herein should not be regarded as a representation or guarantee regarding the reliability, accuracy or completeness of the information contained herein, and neither FS Investments nor the author are under any obligation to update or keep current such information.

All investing is subject to risk, including the possible loss of the money you invest.

Search our site