Chart of the week

Economic activity and volatility both slow. But for how long?

Economic activity has slowed recently, and so has market volatility. Our chart examines this relationship and asks how much longer it can last.

August 7, 2020 | 2 minute read

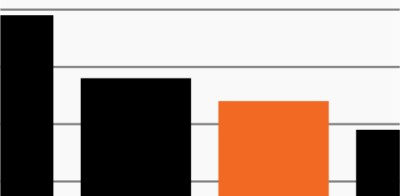
Correlation between COVID-19 rates and economic activity vs. volatility

Source: Federal Reserve Bank of Dallas and Federal Reserve Bank of St. Louis, latest data available. A correlation of -1 indicates a perfect, inverse relationship between economic activity (e.g., hours worked, dining traffic, mobility) and new COVID-19 cases. Correlation is measured on a rolling 4-week basis.

  • By one measure, hiring fell far short of expectations in July. According to ADP, U.S. businesses hired just 167,000 new workers compared to expectations for 1.2 million. ADP’s figures, though preliminary and for just one month, reflect mounting evidence that economic growth, more than any other factor, is tied to progress in tempering growth in COVID-19 cases.
  • To that end, a recent report published by the Dallas Fed highlights the consistent negative correlation since June between new COVID cases and economic activity on a national basis.1 In other words, economic activity has declined the most in states that have seen the most growth in new COVID cases. 
  • The black line in the chart shows this negative correlation. Somewhat perversely, however, as the daily new COVID case count remains above 50,000 and national economic activity has moderated, so have market expectations for near-term equity volatility (orange line).2 After peaking in mid-March, the CBOE Volatility Index (VIX) has declined gradually and now sits at February levels.
  • Equity investors appear to be betting that additional fiscal and monetary support will prop up the U.S. economy and keep markets satisfied. They may prove to be correct, yet data shows that the economic recovery thus far has been bumpy.
  • Infections continue to rise in some regions, the political landscape remains fraught heading into election season, and the initial market bounce has begun moving sideways. Despite investors’ apparent confidence, prudent investors may be wise to prepare their portfolios for an imbalanced recovery that may feature further bouts of volatility.

  • Federal Reserve Bank of Dallas Mobility and Engagement Index, https://bit.ly/2PwUYLv.

  • Federal Reserve Bank of Dallas and Federal Reserve Bank of St. Louis, latest data available.

The chart of the week and any accompanying data is for informational purposes only and shall not be considered an investment recommendation or promotion of FS Investments or any FS Investments fund. The chart of the week is subject to change at any time based on market or other conditions, and FS Investments and FS Investment Solutions, LLC disclaim any responsibility to update such market commentary. The chart of the week should not be relied on as investment advice, and because investment decisions for the FS Investments funds are based on numerous factors, may not be relied on as an indication of the investment intent of any FS Investments fund. None of FS Investments, its funds, FS Investment Solutions, LLC or their respective affiliates can be held responsible for any direct or incidental loss incurred as a result of any reliance on the chart of the week or other opinions expressed therein. Any discussion of past performance should not be used as an indicator of future results.

This information is educational in nature and does not constitute a financial promotion, investment advice or an inducement or incitement to participate in any product, offering or investment. FS Investments is not adopting, making a recommendation for or endorsing any investment strategy or particular security. All views, opinions and positions expressed herein are that of the author and do not necessarily reflect the views, opinions or positions of FS Investments. All opinions are subject to change without notice, and you should always obtain current information and perform due diligence before participating in any investment. FS Investments does not provide legal or tax advice and the information herein should not be considered legal or tax advice. Tax laws and regulations are complex and subject to change, which can materially impact any investment result. FS Investments cannot guarantee that the information herein is accurate, complete, or timely. FS Investments makes no warranties with regard to such information or results obtained by its use, and disclaims any liability arising out of your use of, or any tax position taken in reliance on, such information.

Any projections, forecasts and estimates contained herein are based upon certain assumptions that the author considers reasonable. Projections are necessarily speculative in nature, and it can be expected that some or all of the assumptions underlying the projections will not materialize or will vary significantly from actual results. The inclusion of projections herein should not be regarded as a representation or guarantee regarding the reliability, accuracy or completeness of the information contained herein, and neither FS Investments nor the author are under any obligation to update or keep current such information.

All investing is subject to risk, including the possible loss of the money you invest.

Search our site