Chart of the week

Rates continue recent rise despite sharp stock sell-off

Rates climbed higher this week while the S&P 500 was down nearly -5%. We look at the risk rates’ recent rise presents to fixed income investments.

October 30, 2020 | 2 minute read

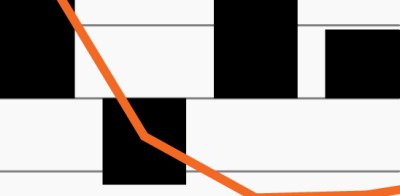
Stocks and Treasury yields move in opposite directions

Source: Federal Reserve Bank of St. Louis, as of October 29, 2020.

  • The 10-year U.S. Treasury yield has quietly begun to climb higher in recent months, pressuring bond prices in the process. Treasuries’ recent rise seems to have been driven by growing speculation that a Biden administration, if elected, might pass additional fiscal stimulus measures along with greater infrastructure spending.
  • Yet the 10-year’s move since early September has been particularly notable as it has reversed the trend of stocks plowing ahead through much of the year while Treasury yields remained anchored near rock-bottom levels. Rates have moved higher (and bond prices lower) despite significantly more caution taking over equity markets.
  • Treasury yields showed their recent resilience this week, moving slightly higher through Thursday, while the S&P 500 was down nearly -5%. With stocks under duress like this, investors normally might flee to the safety of Treasuries, sending their yields lower and pushing prices higher on traditional bonds.1 Gold, another traditional hedge against equity volatility, also moved lower this week, declining approximately -1.3%.1
  • We’ve noted before the difficult position that traditional bonds are in today. They continue to offer little income even as rates seem to have taken a sustainable step up from their lows this summer. At the same time, duration risk for many core fixed income allocations is elevated, leading to potentially greater losses should rates rise further.
  • Within today’s environment, investors may seek opportunities in investments such as high yield bonds or senior secured loans whose performance has historically been uncorrelated to interest rate changes.

  • Federal Reserve Bank of St. Louis, Goldprice.org, as of October 29, 2020.

The chart of the week and any accompanying data is for informational purposes only and shall not be considered an investment recommendation or promotion of FS Investments or any FS Investments fund. The chart of the week is subject to change at any time based on market or other conditions, and FS Investments and FS Investment Solutions, LLC disclaim any responsibility to update such market commentary. The chart of the week should not be relied on as investment advice, and because investment decisions for the FS Investments funds are based on numerous factors, may not be relied on as an indication of the investment intent of any FS Investments fund. None of FS Investments, its funds, FS Investment Solutions, LLC or their respective affiliates can be held responsible for any direct or incidental loss incurred as a result of any reliance on the chart of the week or other opinions expressed therein. Any discussion of past performance should not be used as an indicator of future results.

This information is educational in nature and does not constitute a financial promotion, investment advice or an inducement or incitement to participate in any product, offering or investment. FS Investments is not adopting, making a recommendation for or endorsing any investment strategy or particular security. All views, opinions and positions expressed herein are that of the author and do not necessarily reflect the views, opinions or positions of FS Investments. All opinions are subject to change without notice, and you should always obtain current information and perform due diligence before participating in any investment. FS Investments does not provide legal or tax advice and the information herein should not be considered legal or tax advice. Tax laws and regulations are complex and subject to change, which can materially impact any investment result. FS Investments cannot guarantee that the information herein is accurate, complete, or timely. FS Investments makes no warranties with regard to such information or results obtained by its use, and disclaims any liability arising out of your use of, or any tax position taken in reliance on, such information.

Any projections, forecasts and estimates contained herein are based upon certain assumptions that the author considers reasonable. Projections are necessarily speculative in nature, and it can be expected that some or all of the assumptions underlying the projections will not materialize or will vary significantly from actual results. The inclusion of projections herein should not be regarded as a representation or guarantee regarding the reliability, accuracy or completeness of the information contained herein, and neither FS Investments nor the author are under any obligation to update or keep current such information.

All investing is subject to risk, including the possible loss of the money you invest.

Search our site