Chart of the week

Commercial real estate values rise despite recession

CRE prices have risen in the past year despite the pandemic. This week’s chart looks at why and asks what it means for the next cycle.

February 5, 2021 | 2 minute read

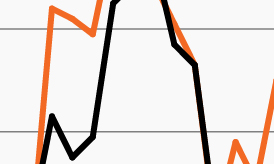
CRE valuations during COVID vs. GFC

Source: Real Capital Analytics (RCA), NCREIF, Macrobond, FS Investments, as of December 31, 2020. The RCA Commercial Property Price Index (CPPI) employs a transaction-based formula to gauge changes in property values while the NCREIF measures changes based on appraisals of property prices.

  • The Fed’s January 2021 survey of senior loan officers highlighted a renewed sense of optimism in the commercial real estate (CRE) market as demand for CRE loans jumped from a quarter earlier. In fact, despite the ongoing pandemic and economic recession, major CRE valuation gauges have remained impressively resilient.
  • The chart shows the performance of two indexes that track commercial real estate, the National Council of Real Estate Investment Fiduciaries (NCREIF) Index and the RCA Commercial Property Price Index (CPPI), around the current recession and the Global Financial Crisis (GFC) of 2008–09.
  • Both indexes faced sustained and significant declines during the GFC, as would be expected given that CRE property prices generally experience weakness during recessions. Just as it has been in so many ways, however, the COVID crisis is turning out to be an exception to the rule, as both indexes held firm in 2020 and even began to move higher.1
  • Looking at 2020 performance data without context, one might ask whether there was a recession at all. Instead, CRE prices have been supported by a combination of 1) a lack of distressed sales, 2) massive fiscal stimulus measures, and 3) significant investor demand for CRE assets in the face of historically low yields across many asset classes.
  • The CRE market’s resilience amid COVID has been a welcome surprise. Unlike during the GFC, however, it has minimized investors’ potential to “buy the dip” and potentially upended the normal CRE investment cycle. With investors focused on how the use case for different property types has changed, the next market cycle could look very different from the last.

  • Real Capital Analytics (RCA), NCREIF, Macrobond, FS Investments, as of December 31, 2020. The RCA Commercial Property Price Index (CPPI) employs a transaction-based formula to gauge changes in property values while the NCREIF measures changes in property values based on appraisals of property prices.

The chart of the week and any accompanying data is for informational purposes only and shall not be considered an investment recommendation or promotion of FS Investments or any FS Investments fund. The chart of the week is subject to change at any time based on market or other conditions, and FS Investments and FS Investment Solutions, LLC disclaim any responsibility to update such market commentary. The chart of the week should not be relied on as investment advice, and because investment decisions for the FS Investments funds are based on numerous factors, may not be relied on as an indication of the investment intent of any FS Investments fund. None of FS Investments, its funds, FS Investment Solutions, LLC or their respective affiliates can be held responsible for any direct or incidental loss incurred as a result of any reliance on the chart of the week or other opinions expressed therein. Any discussion of past performance should not be used as an indicator of future results.

This information is educational in nature and does not constitute a financial promotion, investment advice or an inducement or incitement to participate in any product, offering or investment. FS Investments is not adopting, making a recommendation for or endorsing any investment strategy or particular security. All views, opinions and positions expressed herein are that of the author and do not necessarily reflect the views, opinions or positions of FS Investments. All opinions are subject to change without notice, and you should always obtain current information and perform due diligence before participating in any investment. FS Investments does not provide legal or tax advice and the information herein should not be considered legal or tax advice. Tax laws and regulations are complex and subject to change, which can materially impact any investment result. FS Investments cannot guarantee that the information herein is accurate, complete, or timely. FS Investments makes no warranties with regard to such information or results obtained by its use, and disclaims any liability arising out of your use of, or any tax position taken in reliance on, such information.

Any projections, forecasts and estimates contained herein are based upon certain assumptions that the author considers reasonable. Projections are necessarily speculative in nature, and it can be expected that some or all of the assumptions underlying the projections will not materialize or will vary significantly from actual results. The inclusion of projections herein should not be regarded as a representation or guarantee regarding the reliability, accuracy or completeness of the information contained herein, and neither FS Investments nor the author are under any obligation to update or keep current such information.

All investing is subject to risk, including the possible loss of the money you invest.

Search our site