Chart of the week

Inflation: Here today and gone tomorrow, or here to stay?

The inflation debate turns from speculation to reality. Our chart breaks down April’s CPI report and suggests one takeaway could be higher volatility.

May 14, 2021 | 2 minute read

Monthly change in CPI by component

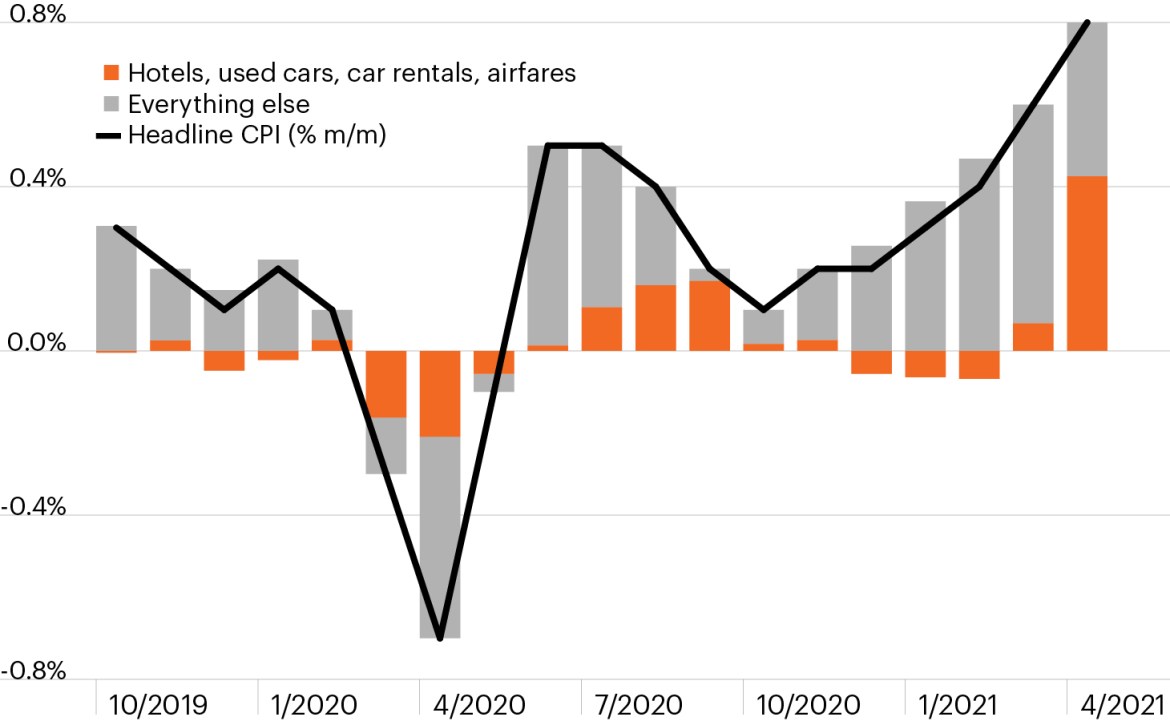
Source: Bloomberg Finance, L.P., as of April 30, 2021. Based on data from the U.S. Bureau of Labor Statistics.

  • For much of this year, investor concerns surrounding inflation were purely speculative. However, April CPI data showed consumer prices rising 0.8% from a month earlier and 4.2% from a year earlier — the first month to show inflation indeed running significantly higher than expected.1
  • Aside from some volatility in the equity markets, though, the market reaction was largely muted. The 10-year U.S. Treasury yield moved higher but remains in the same range it’s occupied since mid-March. Market-based expectations for Fed rate hikes, meanwhile, are largely unchanged from a month ago.
  • Digging into the CPI data may reveal a potential reason for the muted market reaction: A notable part of the CPI increase may prove to be transitory. Used car and airfare prices both jumped 10% from a month earlier.1 Together with other COVID-sensitive areas (hotels and car rentals), these components account for only about 5% of the CPI but accounted for half of the monthly increase.1
  • The rise in used car prices could prove to be the short-lived result of supply-side bottlenecks in the new car market, while it seems likely that airfare hikes are the result of a post-pandemic reopening. Other areas of the CPI report, which might drive prices higher on a more sustained basis, remained modest. Shelter and owners’ equivalent rent, for example, rose just 0.2% from a month earlier.
  • With just one month’s data in hand, investors are left to speculate as to whether higher inflation is a passing trend or a sobering new reality. Whatever answer proves true, it seems fair for investors to prepare for further market choppiness, as the coming months are ripe for continued speculation.

  • Bloomberg Finance, L.P., as of April 30, 2021. Based on data from the U.S. Bureau of Labor Statistics.

The chart of the week and any accompanying data is for informational purposes only and shall not be considered an investment recommendation or promotion of FS Investments or any FS Investments fund. The chart of the week is subject to change at any time based on market or other conditions, and FS Investments and FS Investment Solutions, LLC disclaim any responsibility to update such market commentary. The chart of the week should not be relied on as investment advice, and because investment decisions for the FS Investments funds are based on numerous factors, may not be relied on as an indication of the investment intent of any FS Investments fund. None of FS Investments, its funds, FS Investment Solutions, LLC or their respective affiliates can be held responsible for any direct or incidental loss incurred as a result of any reliance on the chart of the week or other opinions expressed therein. Any discussion of past performance should not be used as an indicator of future results.

This information is educational in nature and does not constitute a financial promotion, investment advice or an inducement or incitement to participate in any product, offering or investment. FS Investments is not adopting, making a recommendation for or endorsing any investment strategy or particular security. All views, opinions and positions expressed herein are that of the author and do not necessarily reflect the views, opinions or positions of FS Investments. All opinions are subject to change without notice, and you should always obtain current information and perform due diligence before participating in any investment. FS Investments does not provide legal or tax advice and the information herein should not be considered legal or tax advice. Tax laws and regulations are complex and subject to change, which can materially impact any investment result. FS Investments cannot guarantee that the information herein is accurate, complete, or timely. FS Investments makes no warranties with regard to such information or results obtained by its use, and disclaims any liability arising out of your use of, or any tax position taken in reliance on, such information.

Any projections, forecasts and estimates contained herein are based upon certain assumptions that the author considers reasonable. Projections are necessarily speculative in nature, and it can be expected that some or all of the assumptions underlying the projections will not materialize or will vary significantly from actual results. The inclusion of projections herein should not be regarded as a representation or guarantee regarding the reliability, accuracy or completeness of the information contained herein, and neither FS Investments nor the author are under any obligation to update or keep current such information.

All investing is subject to risk, including the possible loss of the money you invest.

Search our site