Chart of the week

Commodity prices an inflation canary in the coal mine?

Soaring commodity prices have stoked the inflation debate. Our chart looks at price inflation and suggests one takeaway could be higher volatility.

May 7, 2021 | 2 minute read

S&P GSCI price change, y/y

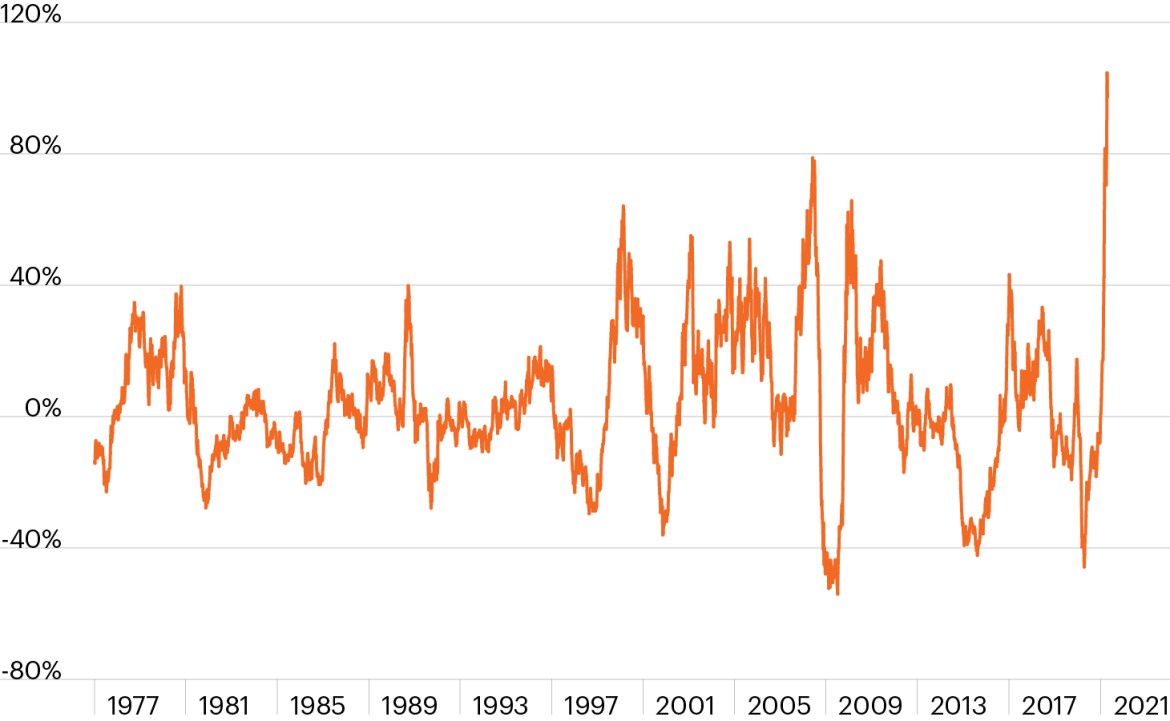
Source: Bloomberg Finance, L.P., as of April 30, 2021. The S&P GSCI is an index measuring the performance of a basket of 24 major commodities.

  • Fears surrounding rising rates and inflation again took center stage this week as Treasury Secretary and former Fed Chair Janet Yellen briefly rattled markets, noting that the Fed may have to raise rates to prevent the U.S. economy from “overheating.”
  • For their part, Fed officials have generally remained on script recently, noting that the inflationary pressures expected in the coming months are likely to be transitory, the result of the “base effect” calculation caused by slumping prices in 2020.
  • The contrasting views on inflation among such high-profile officials are notable, but also simply representative of the competing views among investors today. Against a backdrop of rapidly accelerating economic growth and the fastest-ever appreciation in commodity prices, as shown in the chart, it would be fair for investors to be skeptical that pending inflationary pressures are just transitory.1
  • Futures markets, however, support the idea that inflation of commodity prices, at least, may be passing. While the year-over-year change in the S&P GSCI is unprecedented, major commodity markets are also showing the steepest backwardation in more than a decade.1 Said another way, spot prices are higher than prices trading in the futures market. This has historically been a sign that investors believe today’s high prices are a short-lived reality and not necessarily indicative of a new, higher-inflation regime.
  • Of course, one side in this argument over inflation will ultimately be proven wrong. As we wait to see which side is right, however, what seems certain is that rate-sensitive fixed income and equity markets could see sustained choppiness as the debate rages on.

  • Bloomberg Finance, L.P., FS Investments, as of May 5, 2021. The S&P GSCI is an index measuring the performance of a basket of 24 major commodities.

The chart of the week and any accompanying data is for informational purposes only and shall not be considered an investment recommendation or promotion of FS Investments or any FS Investments fund. The chart of the week is subject to change at any time based on market or other conditions, and FS Investments and FS Investment Solutions, LLC disclaim any responsibility to update such market commentary. The chart of the week should not be relied on as investment advice, and because investment decisions for the FS Investments funds are based on numerous factors, may not be relied on as an indication of the investment intent of any FS Investments fund. None of FS Investments, its funds, FS Investment Solutions, LLC or their respective affiliates can be held responsible for any direct or incidental loss incurred as a result of any reliance on the chart of the week or other opinions expressed therein. Any discussion of past performance should not be used as an indicator of future results.

This information is educational in nature and does not constitute a financial promotion, investment advice or an inducement or incitement to participate in any product, offering or investment. FS Investments is not adopting, making a recommendation for or endorsing any investment strategy or particular security. All views, opinions and positions expressed herein are that of the author and do not necessarily reflect the views, opinions or positions of FS Investments. All opinions are subject to change without notice, and you should always obtain current information and perform due diligence before participating in any investment. FS Investments does not provide legal or tax advice and the information herein should not be considered legal or tax advice. Tax laws and regulations are complex and subject to change, which can materially impact any investment result. FS Investments cannot guarantee that the information herein is accurate, complete, or timely. FS Investments makes no warranties with regard to such information or results obtained by its use, and disclaims any liability arising out of your use of, or any tax position taken in reliance on, such information.

Any projections, forecasts and estimates contained herein are based upon certain assumptions that the author considers reasonable. Projections are necessarily speculative in nature, and it can be expected that some or all of the assumptions underlying the projections will not materialize or will vary significantly from actual results. The inclusion of projections herein should not be regarded as a representation or guarantee regarding the reliability, accuracy or completeness of the information contained herein, and neither FS Investments nor the author are under any obligation to update or keep current such information.

All investing is subject to risk, including the possible loss of the money you invest.

Search our site