Chart of the week

CRE property price growth well above its pre-COVID pace

Commercial real estate property prices rose in August at their fastest pace since 2005. Our chart compares growth today to before the pandemic.

October 15, 2021 | 2 minute read

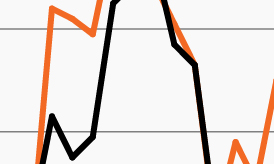
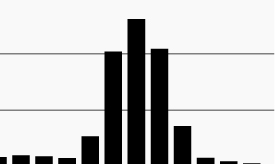
Property price growth: Before and after 2020

Source: Real Capital Analytics, as of August 2021. Latest data available. 

  • U.S. commercial real estate (CRE) property prices have risen in recent months even as major equity and fixed income indexes have stalled or turned lower. In August, all four major property types (apartment, industrial, office and retail) posted double digit annual returns while the broad-based RCA Commercial Property Price Index (CPPI) grew 13.5%, its highest level since 2005.1
  • While massive government stimulus acted as a bridge throughout the pandemic, helping to support prices again as conditions improved in 2020, the CRE market today appears to be on solid footing again as investor sentiment has improved and pandemic-induced distress continues to abate.
  • As the chart shows, the pace of CRE property price growth is markedly faster today than the slow-but-steady growth seen before the pandemic.1 (Note that the chart does not include property price growth in 2020, which may have been distorted by the spread of the pandemic and subsequent government assistance).
  • The dispersion in returns across CRE property types today remains wide. Yet some of the many changes the pandemic introduced to daily life have been supportive to large CRE property types. Multifamily, for example, has benefited from strong job growth this year while an increasingly expensive housing market continues to stoke demand for apartment rentals. Meanwhile, industrial entered the pandemic in solid shape but has benefited greatly from outsized demand for e-commerce since the start of the crisis.
  • Any new expansion brings with it its own challenges and today is no different. Elevated inflation brought on by persistent supply chain issues and a more hawkish Federal Reserve could dampen sentiment toward the sector. Amid broad-based price gains, however, the macro backdrop continues to be supportive to the CRE market.

  • Real Capital Analytics, based on latest data available.

The chart of the week and any accompanying data is for informational purposes only and shall not be considered an investment recommendation or promotion of FS Investments or any FS Investments fund. The chart of the week is subject to change at any time based on market or other conditions, and FS Investments and FS Investment Solutions, LLC disclaim any responsibility to update such market commentary. The chart of the week should not be relied on as investment advice, and because investment decisions for the FS Investments funds are based on numerous factors, may not be relied on as an indication of the investment intent of any FS Investments fund. None of FS Investments, its funds, FS Investment Solutions, LLC or their respective affiliates can be held responsible for any direct or incidental loss incurred as a result of any reliance on the chart of the week or other opinions expressed therein. Any discussion of past performance should not be used as an indicator of future results.

This information is educational in nature and does not constitute a financial promotion, investment advice or an inducement or incitement to participate in any product, offering or investment. FS Investments is not adopting, making a recommendation for or endorsing any investment strategy or particular security. All views, opinions and positions expressed herein are that of the author and do not necessarily reflect the views, opinions or positions of FS Investments. All opinions are subject to change without notice, and you should always obtain current information and perform due diligence before participating in any investment. FS Investments does not provide legal or tax advice and the information herein should not be considered legal or tax advice. Tax laws and regulations are complex and subject to change, which can materially impact any investment result. FS Investments cannot guarantee that the information herein is accurate, complete, or timely. FS Investments makes no warranties with regard to such information or results obtained by its use, and disclaims any liability arising out of your use of, or any tax position taken in reliance on, such information.

Any projections, forecasts and estimates contained herein are based upon certain assumptions that the author considers reasonable. Projections are necessarily speculative in nature, and it can be expected that some or all of the assumptions underlying the projections will not materialize or will vary significantly from actual results. The inclusion of projections herein should not be regarded as a representation or guarantee regarding the reliability, accuracy or completeness of the information contained herein, and neither FS Investments nor the author are under any obligation to update or keep current such information.

All investing is subject to risk, including the possible loss of the money you invest.

Search our site