Chart of the week

Do rising rates favor CRE debt?

Rising rates have wreaked havoc on markets this year, but this week’s chart points to CRE debt as an area that could potentially benefit from them.

October 14, 2022

Hypothetical % of a property’s net operating income received based on investor type over a 5-year hold period

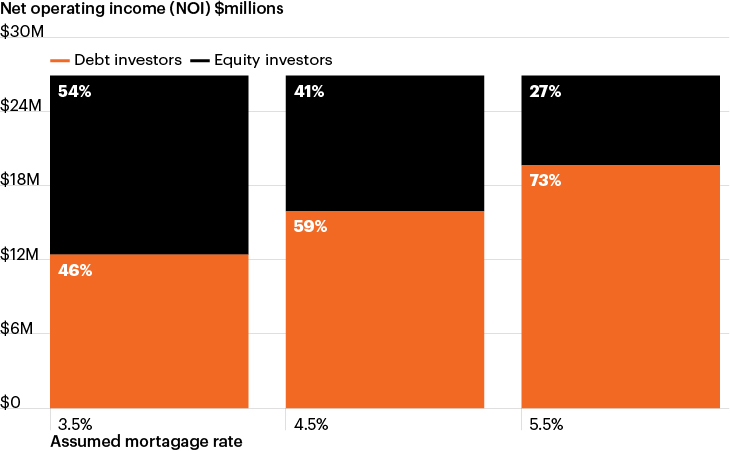
Source: FS Investments. Example shows a hypothetical $100 million property with a 5% cap rate, 67% net operating income margin and 3% annual operating expense growth financed at a 70% loan to value ratio with an interest-only loan and held for five years.

  • Rising rates amid persistent inflationary pressures have presented extraordinary challenges to investors this year resulting in steep declines in the equity and fixed income markets.
  • Commercial real estate (CRE) prices have been noticeably less volatile, yet price growth, while positive across all major property types year over year, has slowed as rising rates pressure valuations and create a broadening divide between buyers and sellers.
  • While slowing price growth implies potentially lower total returns for equity investors, it may also highlight the benefits of senior secured CRE debt in the current environment. 
  • As the chart shows, CRE debt investors capture significantly more of the income generated by a property, as interest rates and mortgage rates increase (for a given cap rate and level of rent growth).The 2-year Treasury yield began the year within shouting distance of its all-time low of 0.78% but has since reached a 15-year high of 4.15%. 
  • In this example, debt investors would capture 46% of cash flow generated over a five-year period when the mortgage rate is 3.5% compared to 73% at a 5.5% mortgage rate.1 (Read more in our Q4 2022 CRE Outlook: Recalibration in Progress.)
  • While CRE equity remains an important element to a broadly diversified portfolio, investors may be wise in tilting their portfolio toward CRE debt amid today’s rising rate environment and cloudy economic outlook. 

  • FS Investments. Example involves a hypothetical $100 million property with a 5% cap rate, 67% net operating income margin and 3% annual operating expense growth financed at a 70% loan to value ratio with an interest-only loan and held for five years.

The chart of the week and any accompanying data is for informational purposes only and shall not be considered an investment recommendation or promotion of FS Investments or any FS Investments fund. The chart of the week is subject to change at any time based on market or other conditions, and FS Investments and FS Investment Solutions, LLC disclaim any responsibility to update such market commentary. The chart of the week should not be relied on as investment advice, and because investment decisions for the FS Investments funds are based on numerous factors, may not be relied on as an indication of the investment intent of any FS Investments fund. None of FS Investments, its funds, FS Investment Solutions, LLC or their respective affiliates can be held responsible for any direct or incidental loss incurred as a result of any reliance on the chart of the week or other opinions expressed therein. Any discussion of past performance should not be used as an indicator of future results.

This information is educational in nature and does not constitute a financial promotion, investment advice or an inducement or incitement to participate in any product, offering or investment. FS Investments is not adopting, making a recommendation for or endorsing any investment strategy or particular security. All views, opinions and positions expressed herein are that of the author and do not necessarily reflect the views, opinions or positions of FS Investments. All opinions are subject to change without notice, and you should always obtain current information and perform due diligence before participating in any investment. FS Investments does not provide legal or tax advice and the information herein should not be considered legal or tax advice. Tax laws and regulations are complex and subject to change, which can materially impact any investment result. FS Investments cannot guarantee that the information herein is accurate, complete, or timely. FS Investments makes no warranties with regard to such information or results obtained by its use, and disclaims any liability arising out of your use of, or any tax position taken in reliance on, such information.

Any projections, forecasts and estimates contained herein are based upon certain assumptions that the author considers reasonable. Projections are necessarily speculative in nature, and it can be expected that some or all of the assumptions underlying the projections will not materialize or will vary significantly from actual results. The inclusion of projections herein should not be regarded as a representation or guarantee regarding the reliability, accuracy or completeness of the information contained herein, and neither FS Investments nor the author are under any obligation to update or keep current such information.

All investing is subject to risk, including the possible loss of the money you invest.

Search our site