Chart of the week

CRE debt has proven resilient during downturns

This week’s chart looks at the resilience of CRE debt during the global financial crisis, highlighting why seniority in the capital structure matters.

June 24, 2022 | 2 minute read

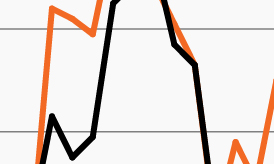
Growth of $100,000 during the global financial crisis

Past performance is not indicative of future results. CRE debt is subject to heightened credit risk, particularly during periods of economic stress.

Source: Bloomberg Finance, L.P., FS Investments, for the four-year period ended March 31, 2011. CRE debt is represented by the Giliberto-Levy Commercial Mortgage Performance Index. The Agg refers to the Bloomberg U.S. Aggregate Bond Index. CRE property prices are represented by the RCA Commercial Property Price Index.

  • Debate about a potential recession in the U.S. has picked up steam recently over concerns that an overly aggressive Fed tightening cycle may lead to a more significant pullback in consumer and business demand.  
  • As investors recalibrate their forward return expectations, the traditional 60/40 portfolio is down -16.7% year to date as stocks and bonds have sold off in unison.1
  • Amid the market turmoil, commercial real estate (CRE) debt has seen a significantly smaller drawdown. The Giliberto-Levy Commercial Mortgage Performance Index, which tracks the performance of fixed-rate, 7–10-year commercial mortgages held on institutional lenders’ balance sheets, returned -4.41% through Q1, as it benefited from a still solid backdrop for CRE investments.
  • In fact, CRE debt has performed well during historical periods of economic softness or recession. This week’s chart looks at its performance through the global financial crisis (GFC). As it shows, the S&P 500 declined nearly -50% in late 2007 while commercial real estate property prices fell more than 30%.2 CRE debt (orange line) fared significantly better with a modest drawdown during the GFC.2
  • Clearly, no two downturns are exactly alike. The GFC was a real estate-driven decline in which the Fed quickly lowered rates to rock bottom levels compared to today’s tightening cycle where real estate fundamentals remain generally strong. Amid today’s uncertain outlook, CRE debt’s seniority in the capital structure (paid ahead of property owners) may be a timely portfolio solution given its historical track record of weathering through economic stress.

  • As of June 22, 2022. 60/40 refers to 60% invested in the S&P 500 Index and 40 in the Bloomberg U.S. Aggregate Index.

  • Bloomberg Finance, L.P., FS Investments, for the four-year period ended March 31, 2011. CRE debt is represented by the Giliberto-Levy Commercial Mortgage Index. The Agg refers to the Bloomberg U.S. Aggregate Bond Index. CRE property prices are represented by the RCA Commercial Property Price Index.

The chart of the week and any accompanying data is for informational purposes only and shall not be considered an investment recommendation or promotion of FS Investments or any FS Investments fund. The chart of the week is subject to change at any time based on market or other conditions, and FS Investments and FS Investment Solutions, LLC disclaim any responsibility to update such market commentary. The chart of the week should not be relied on as investment advice, and because investment decisions for the FS Investments funds are based on numerous factors, may not be relied on as an indication of the investment intent of any FS Investments fund. None of FS Investments, its funds, FS Investment Solutions, LLC or their respective affiliates can be held responsible for any direct or incidental loss incurred as a result of any reliance on the chart of the week or other opinions expressed therein. Any discussion of past performance should not be used as an indicator of future results.

This information is educational in nature and does not constitute a financial promotion, investment advice or an inducement or incitement to participate in any product, offering or investment. FS Investments is not adopting, making a recommendation for or endorsing any investment strategy or particular security. All views, opinions and positions expressed herein are that of the author and do not necessarily reflect the views, opinions or positions of FS Investments. All opinions are subject to change without notice, and you should always obtain current information and perform due diligence before participating in any investment. FS Investments does not provide legal or tax advice and the information herein should not be considered legal or tax advice. Tax laws and regulations are complex and subject to change, which can materially impact any investment result. FS Investments cannot guarantee that the information herein is accurate, complete, or timely. FS Investments makes no warranties with regard to such information or results obtained by its use, and disclaims any liability arising out of your use of, or any tax position taken in reliance on, such information.

Any projections, forecasts and estimates contained herein are based upon certain assumptions that the author considers reasonable. Projections are necessarily speculative in nature, and it can be expected that some or all of the assumptions underlying the projections will not materialize or will vary significantly from actual results. The inclusion of projections herein should not be regarded as a representation or guarantee regarding the reliability, accuracy or completeness of the information contained herein, and neither FS Investments nor the author are under any obligation to update or keep current such information.

All investing is subject to risk, including the possible loss of the money you invest.

Search our site