Chart of the week

CRE debt: An overlooked fixed income asset class?

This week’s chart looks at the components of CRE debt returns since 2007, highlighting income returns, which have more than offset credit losses.

June 3, 2022 | 2 minute read

Giliberto-Levy loan performance

Source: FS Investments, Giliberto-Levy Commercial Mortgage Performance Index. As of February 28, 2023.

  • Much ink has been spilled this year on the lackluster performance of stocks and bonds. The 60/40 portfolio has returned –11.7% this year, driven in large part by the failure of traditional fixed income to serve its historical role as a hedge to falling stock prices.1 Indeed, the Bloomberg U.S Aggregate Index is down -9.2% year to date.
  • As the forward return outlook for traditional fixed remains challenged, this week we highlight commercial real estate (CRE) debt, an asset class that may serve as an alternative source of income and portfolio diversification.
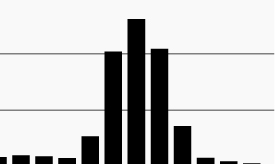
  • The chart shows the return breakdown of the Giliberto-Levy Commercial Mortgage Performance Index, which tracks the performance of commercial mortgages held on institutional lenders’ balance sheets.
  • Income has been the primary driver of returns for the asset class with mild credit losses – even during the depths of the Great Financial Crisis. As the chart shows, credit losses experienced during the crisis were more than offset by income and commercial mortgages have generated positive net returns going back to 2007.
  • While we recognize a slowing economy may impact real estate valuations, fundamentals across the CRE market today remain generally healthy. CRE property prices rose nearly 18% year over year in April while transaction volume remains firm.2 Meanwhile, the delinquency rate on commercial mortgage-backed securities, another large source of debt capital for CRE borrowers, continues to decline from the COVID highs, hitting 3.14% in May.3
  • The CRE market’s strength could be put to the test in the second half of 2022 as mortgage rates rise. Against this backdrop, floating rate CRE debt may be an attractive place for investors given its higher place in the capital structure and historical ability to weather varying rate and macro environments.

  • 60/40 refers to a blended portfolio of 60% S&P 500 Index and 40% Bloomberg U.S. Aggregate Index.

  • Real Capital Analytics, as of April 2022.

  • Trepp, as of May 2022.

The chart of the week and any accompanying data is for informational purposes only and shall not be considered an investment recommendation or promotion of FS Investments or any FS Investments fund. The chart of the week is subject to change at any time based on market or other conditions, and FS Investments and FS Investment Solutions, LLC disclaim any responsibility to update such market commentary. The chart of the week should not be relied on as investment advice, and because investment decisions for the FS Investments funds are based on numerous factors, may not be relied on as an indication of the investment intent of any FS Investments fund. None of FS Investments, its funds, FS Investment Solutions, LLC or their respective affiliates can be held responsible for any direct or incidental loss incurred as a result of any reliance on the chart of the week or other opinions expressed therein. Any discussion of past performance should not be used as an indicator of future results.

This information is educational in nature and does not constitute a financial promotion, investment advice or an inducement or incitement to participate in any product, offering or investment. FS Investments is not adopting, making a recommendation for or endorsing any investment strategy or particular security. All views, opinions and positions expressed herein are that of the author and do not necessarily reflect the views, opinions or positions of FS Investments. All opinions are subject to change without notice, and you should always obtain current information and perform due diligence before participating in any investment. FS Investments does not provide legal or tax advice and the information herein should not be considered legal or tax advice. Tax laws and regulations are complex and subject to change, which can materially impact any investment result. FS Investments cannot guarantee that the information herein is accurate, complete, or timely. FS Investments makes no warranties with regard to such information or results obtained by its use, and disclaims any liability arising out of your use of, or any tax position taken in reliance on, such information.

Any projections, forecasts and estimates contained herein are based upon certain assumptions that the author considers reasonable. Projections are necessarily speculative in nature, and it can be expected that some or all of the assumptions underlying the projections will not materialize or will vary significantly from actual results. The inclusion of projections herein should not be regarded as a representation or guarantee regarding the reliability, accuracy or completeness of the information contained herein, and neither FS Investments nor the author are under any obligation to update or keep current such information.

All investing is subject to risk, including the possible loss of the money you invest.

Search our site