Chart of the week

Concentrated equity market persists in 2023

This week’s chart looks at the massive divide between year-to-date returns on the Big 7 tech stocks and the rest of the S&P 500.

October 11, 2023 | 2 minute read

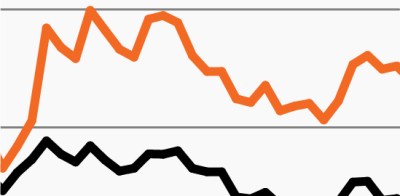
“Big 7” tech stocks vs. the broader S&P

Source: Bloomberg Finance, L.P. as of October 3, 2023. Top 7 contributors refers to a market-cap weighted index of Apple, Amazon, Microsoft, Nvidia, Alphabet, Meta and Tesla. Past performance is no guarantee of future results.

  • U.S. stocks have encountered significant volatility recently as Treasury yields have risen unrelentingly over the past month. Yet, the S&P 500’s headline return of 13.1% through Q3 2023 remains strong even when measured over an annual period. 
  • Digging under the hood, though, the S&P’s return is notably less impressive. It has been extremely concentrated, almost exclusively driven by the largest growth-oriented technology stocks.
  • As the chart shows, a market-weighted index of the largest seven technology stocks has returned 55% year to date, which is more than 5x the return of the broader S&P 500.1
  • As the weighting of the top 10 stocks in the S&P 500 has risen close to its highest on record, approximately 30% of the Index, the S&P 500 equal weight index is down -2% year to date.1
  • Despite the strong headline returns in 2023, the chart highlights the challenging investment environment that remains in place for the majority of stocks, including the need for flexibility and the importance of finding alternative sources of growth.

  • FS Investments and Bloomberg Finance, L.P. as of October 3, 2023. Top 7 contributors refers to a market-cap weighted index of Apple, Amazon, Microsoft, Nvidia, Alphabet, Amazon, Meta and Tesla. Past performance is no guarantee of future results.

The chart of the week and any accompanying data is for informational purposes only and shall not be considered an investment recommendation or promotion of FS Investments or any FS Investments fund. The chart of the week is subject to change at any time based on market or other conditions, and FS Investments and FS Investment Solutions, LLC disclaim any responsibility to update such market commentary. The chart of the week should not be relied on as investment advice, and because investment decisions for the FS Investments funds are based on numerous factors, may not be relied on as an indication of the investment intent of any FS Investments fund. None of FS Investments, its funds, FS Investment Solutions, LLC or their respective affiliates can be held responsible for any direct or incidental loss incurred as a result of any reliance on the chart of the week or other opinions expressed therein. Any discussion of past performance should not be used as an indicator of future results.

This information is educational in nature and does not constitute a financial promotion, investment advice or an inducement or incitement to participate in any product, offering or investment. FS Investments is not adopting, making a recommendation for or endorsing any investment strategy or particular security. All views, opinions and positions expressed herein are that of the author and do not necessarily reflect the views, opinions or positions of FS Investments. All opinions are subject to change without notice, and you should always obtain current information and perform due diligence before participating in any investment. FS Investments does not provide legal or tax advice and the information herein should not be considered legal or tax advice. Tax laws and regulations are complex and subject to change, which can materially impact any investment result. FS Investments cannot guarantee that the information herein is accurate, complete, or timely. FS Investments makes no warranties with regard to such information or results obtained by its use, and disclaims any liability arising out of your use of, or any tax position taken in reliance on, such information.

Any projections, forecasts and estimates contained herein are based upon certain assumptions that the author considers reasonable. Projections are necessarily speculative in nature, and it can be expected that some or all of the assumptions underlying the projections will not materialize or will vary significantly from actual results. The inclusion of projections herein should not be regarded as a representation or guarantee regarding the reliability, accuracy or completeness of the information contained herein, and neither FS Investments nor the author are under any obligation to update or keep current such information.

All investing is subject to risk, including the possible loss of the money you invest.

Search our site