Chart of the week

Falling equity yields predicting too rosy a scenario?

As the equity premium has declined, stocks may not be compensating investors given today’s macro risks.

September 29, 2023 | 2 minute read

Relative yields, U.S. equity market vs. Treasuries

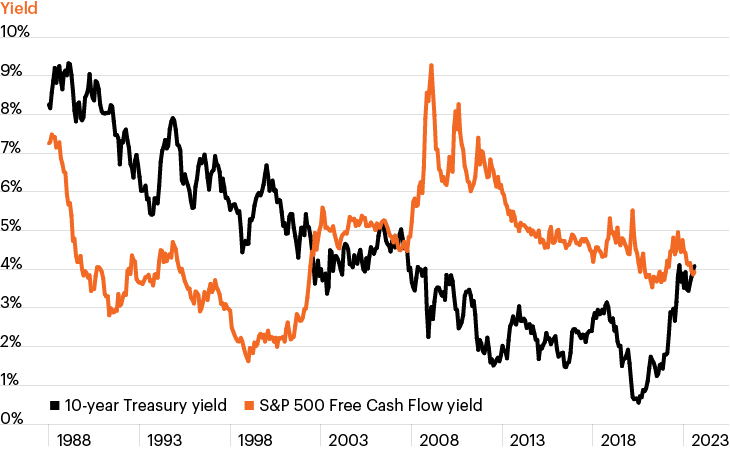
Source: Bloomberg Finance, L.P., as of August 31, 2023.

  • Comparing equity yields to those available on risk-free bonds is a common way for analysts to decipher the level of excess return investors demand to assume equity market risk—that is, the equity risk premium.
  • One way to measure equity yield is the free cash flow (FCF) yield, which is a valuation metric comparing FCF generated over the past 12 months to current equity prices. As the chart shows, the U.S. large cap FCF yield is about equal to the 10-year U.S. Treasury yield.
  • It is important to stress that because equity FCF grows—sometimes quite substantially—over most periods while bond coupons remain static, this is not a perfect relationship. During the 1980s and 1990s, Treasuries yielded significantly more than equities, while in the 2010s the opposite was true.
  • However, the relationship can be a useful way to gauge investors’ overall sentiment toward risk-taking. Economic skepticism throughout the 2010s kept yields on equities persistently higher than those on bonds, even as U.S. tech firms produced impressive margins.
  • Today’s equity yield suggests enhanced earnings growth expectations and an abatement in skepticism around the economy. While many investors have been counting on the Fed engineering a soft landing, the equity risk premium does not appear to be sufficiently compensating investors for the material risks still present in the current economic backdrop.

The chart of the week and any accompanying data is for informational purposes only and shall not be considered an investment recommendation or promotion of FS Investments or any FS Investments fund. The chart of the week is subject to change at any time based on market or other conditions, and FS Investments and FS Investment Solutions, LLC disclaim any responsibility to update such market commentary. The chart of the week should not be relied on as investment advice, and because investment decisions for the FS Investments funds are based on numerous factors, may not be relied on as an indication of the investment intent of any FS Investments fund. None of FS Investments, its funds, FS Investment Solutions, LLC or their respective affiliates can be held responsible for any direct or incidental loss incurred as a result of any reliance on the chart of the week or other opinions expressed therein. Any discussion of past performance should not be used as an indicator of future results.

This information is educational in nature and does not constitute a financial promotion, investment advice or an inducement or incitement to participate in any product, offering or investment. FS Investments is not adopting, making a recommendation for or endorsing any investment strategy or particular security. All views, opinions and positions expressed herein are that of the author and do not necessarily reflect the views, opinions or positions of FS Investments. All opinions are subject to change without notice, and you should always obtain current information and perform due diligence before participating in any investment. FS Investments does not provide legal or tax advice and the information herein should not be considered legal or tax advice. Tax laws and regulations are complex and subject to change, which can materially impact any investment result. FS Investments cannot guarantee that the information herein is accurate, complete, or timely. FS Investments makes no warranties with regard to such information or results obtained by its use, and disclaims any liability arising out of your use of, or any tax position taken in reliance on, such information.

Any projections, forecasts and estimates contained herein are based upon certain assumptions that the author considers reasonable. Projections are necessarily speculative in nature, and it can be expected that some or all of the assumptions underlying the projections will not materialize or will vary significantly from actual results. The inclusion of projections herein should not be regarded as a representation or guarantee regarding the reliability, accuracy or completeness of the information contained herein, and neither FS Investments nor the author are under any obligation to update or keep current such information.

All investing is subject to risk, including the possible loss of the money you invest.

Search our site