Chart of the week

An income-centric market as CRE price growth falters?

Rising cap rates have challenged the economics for CRE property owners. But CRE debt has become increasingly attractive, as this week’s chart shows.

March 10, 2023 | 2 minute read

Attribution of CRE property price growth

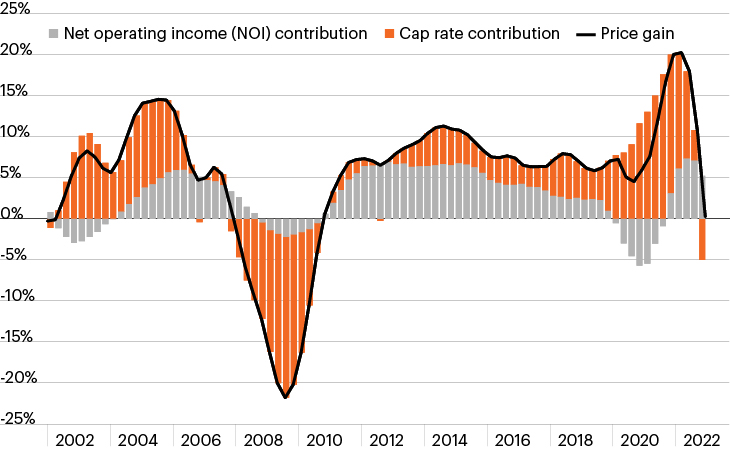
Source: MCSI Real Capital Analytics, as of December 31, 2022. Latest data available.

  • Since the global financial crisis (GFC), the commercial real estate (CRE) market generally enjoyed a period of solid price appreciation, driven by steady economic growth and low interest rates.
  • Falling cap rates, which steadily declined amid the extended low- or zero-interest rate environment, accounted for a meaningful amount (56%) of total CRE price growth since 2011.1 Since January 2020, cap rates drove for virtually all CRE property price growth amid the Fed’s prevailing zero-interest rate policy.1
  • The rising rate environment in 2022, however, began to usher in a significant change in the makeup of CRE returns.
  • As the chart shows, cap rates’ contribution to price growth declined in Q3 2022 and meaningfully detracted from it in Q4. Over the same time frame, income has represented a growing percentage of price growth. 
  • With peak Fed hawkishness still not yet in sight, the economics supporting CRE price growth could remain challenging. However, declining CRE property values highlight the potential benefits of CRE debt, as income will likely represent a greater percentage of total return in the coming months. Importantly, debt markets remain on solid footing as lenders have generally kept in place the conservative approach they adopted during the GFC.

  • MCSI Real Capital Analytics and FS Investments, as of December 31, 2022. Latest data available. Capitalization rate is used to indicate the rate of return that is expected to be generated on a real estate investment property.

The chart of the week and any accompanying data is for informational purposes only and shall not be considered an investment recommendation or promotion of FS Investments or any FS Investments fund. The chart of the week is subject to change at any time based on market or other conditions, and FS Investments and FS Investment Solutions, LLC disclaim any responsibility to update such market commentary. The chart of the week should not be relied on as investment advice, and because investment decisions for the FS Investments funds are based on numerous factors, may not be relied on as an indication of the investment intent of any FS Investments fund. None of FS Investments, its funds, FS Investment Solutions, LLC or their respective affiliates can be held responsible for any direct or incidental loss incurred as a result of any reliance on the chart of the week or other opinions expressed therein. Any discussion of past performance should not be used as an indicator of future results.

This information is educational in nature and does not constitute a financial promotion, investment advice or an inducement or incitement to participate in any product, offering or investment. FS Investments is not adopting, making a recommendation for or endorsing any investment strategy or particular security. All views, opinions and positions expressed herein are that of the author and do not necessarily reflect the views, opinions or positions of FS Investments. All opinions are subject to change without notice, and you should always obtain current information and perform due diligence before participating in any investment. FS Investments does not provide legal or tax advice and the information herein should not be considered legal or tax advice. Tax laws and regulations are complex and subject to change, which can materially impact any investment result. FS Investments cannot guarantee that the information herein is accurate, complete, or timely. FS Investments makes no warranties with regard to such information or results obtained by its use, and disclaims any liability arising out of your use of, or any tax position taken in reliance on, such information.

Any projections, forecasts and estimates contained herein are based upon certain assumptions that the author considers reasonable. Projections are necessarily speculative in nature, and it can be expected that some or all of the assumptions underlying the projections will not materialize or will vary significantly from actual results. The inclusion of projections herein should not be regarded as a representation or guarantee regarding the reliability, accuracy or completeness of the information contained herein, and neither FS Investments nor the author are under any obligation to update or keep current such information.

All investing is subject to risk, including the possible loss of the money you invest.

Search our site