Chart of the week

Despite headlines, CRE fundamentals mostly healthy

Despite the significant headline risk, CRE fundamentals continue to be quite stable. This week’s chart looks at vacancy rates across property types.

May 26, 2023 | 2 minute read

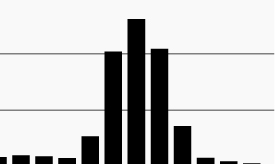
CRE vacancy rates by property type

Source: MSCI Real Capital Analytics, as of April 30, 2023.

  • Amid regional bank stress, tightening lending standards and rising mortgage rates, the commercial real estate (CRE) market remains among investors’ primary concerns. Indeed, it is in the process of a correction as CRE property prices and deal volume have declined precipitously as buyers and sellers seek a new equilibrium.
  • Despite the macro stress and headline risk, the CRE market is very large and diverse with multiple performance drivers. Notably, the recent correction appears to be primarily driven by rising rates as opposed to weakening fundamentals. In fact, the underlying cash flow fundamentals for most property types outside of office continue to be quite stable.
  • As the chart shows, national vacancy rates in three of the four major property types remain well contained, either in line with the pre-COVID trend or well below it in the case of industrial.1
  • Office is the clear outlier as its stress has been well documented. Office is a key real estate sector, but also has become a much smaller component of the market over time (just 14% of sale volumes over the past 12 months through April).1
  • While fundamentals remain solid across much of the CRE market, the price correction could remain in place as the market comes to terms with higher financing costs. Against this backdrop, returns will likely be driven by income, rather than price appreciation as it was for much of the past decade. In turn, the risk/reward outlook looks to favor lenders over borrowers. 

  • MSCI Real Capital Analytics, as of April 30, 2023.

The chart of the week and any accompanying data is for informational purposes only and shall not be considered an investment recommendation or promotion of FS Investments or any FS Investments fund. The chart of the week is subject to change at any time based on market or other conditions, and FS Investments and FS Investment Solutions, LLC disclaim any responsibility to update such market commentary. The chart of the week should not be relied on as investment advice, and because investment decisions for the FS Investments funds are based on numerous factors, may not be relied on as an indication of the investment intent of any FS Investments fund. None of FS Investments, its funds, FS Investment Solutions, LLC or their respective affiliates can be held responsible for any direct or incidental loss incurred as a result of any reliance on the chart of the week or other opinions expressed therein. Any discussion of past performance should not be used as an indicator of future results.

This information is educational in nature and does not constitute a financial promotion, investment advice or an inducement or incitement to participate in any product, offering or investment. FS Investments is not adopting, making a recommendation for or endorsing any investment strategy or particular security. All views, opinions and positions expressed herein are that of the author and do not necessarily reflect the views, opinions or positions of FS Investments. All opinions are subject to change without notice, and you should always obtain current information and perform due diligence before participating in any investment. FS Investments does not provide legal or tax advice and the information herein should not be considered legal or tax advice. Tax laws and regulations are complex and subject to change, which can materially impact any investment result. FS Investments cannot guarantee that the information herein is accurate, complete, or timely. FS Investments makes no warranties with regard to such information or results obtained by its use, and disclaims any liability arising out of your use of, or any tax position taken in reliance on, such information.

Any projections, forecasts and estimates contained herein are based upon certain assumptions that the author considers reasonable. Projections are necessarily speculative in nature, and it can be expected that some or all of the assumptions underlying the projections will not materialize or will vary significantly from actual results. The inclusion of projections herein should not be regarded as a representation or guarantee regarding the reliability, accuracy or completeness of the information contained herein, and neither FS Investments nor the author are under any obligation to update or keep current such information.

All investing is subject to risk, including the possible loss of the money you invest.

Search our site