

Public markets: Beware what lies beneath the surface
Despite hitting a speed bump in April, the S&P 500 has pushed higher this year (up 6.64% as the time of writing) thanks in large part to the performance of the often-discussed Magnificent 7—and anything remotely touching AI.1 Investor FOMO has translated to FOMM (fear of missing momentum) as evident in the momentum factor’s performance in Q1 which was strong enough to land in the 98th percentile.2
The strong headline numbers mask the realities beneath the surface. While the Magnificent 7 has climbed 10.03% year-to-date, the S&P 493 has returned only 5.17%. Meanwhile small and mid-cap stocks are in negative territory following April’s pullback. The Russell 2000 is down -2.56% year-to-date as the quality of the index continues to fall.1 The percentage of small cap companies generating negative earnings has increased from ~25% in 2012 to 41% today.1 While market leadership and index performance could certainly come into better balance in 2024, investors may be wise to maintain a healthy balance of fear and “well-placed” greed given elevated equity valuations, persistent inflation and a still uncertain rate outlook amid the Fed’s efforts to reduce their balance sheet through quantitative tightening.
Well-placed greed doesn’t mean ignoring or discounting investment risks. Rather, it can be the product of successfully distinguishing perceived risks from actual risks and finding investments that may perform well despite—or even because—of these risks. The U.S. middle market, in our view, is a good destination for some well-placed greed today.
Private middle market: The engine of the U.S. economy
The U.S. middle market—comprised of 200,000 companies with annual revenue between $10 million–$1 billion—has served as a driving force of the domestic economy for decades, representing one-third of private sector GDP and employing 48 million Americans.3 The middle market has thrived in the post-pandemic era with 83% of middle market firms reporting positive year-over-year revenue growth in 2023—the highest reading on record—alongside strong employment gains.3
Capitalizing on the middle market: Why bigger isn’t always better
The vast size and makeup of the middle market presents both challenges and opportunities to extract value. Private equity funds have historically served as the primary way to invest in this diverse segment of the economy.
Middle market private equity managers have outperformed their large/mega cap peers over the long term. In fact, upper quartile U.S. middle market buyout funds have outperformed large cap funds by over 500 basis points.4 Alpha generation has been driven by manager skill as well as attributes that are unique to the middle market and proven to be persistent over time, including:
- Lower pricing
- Less reliance on leverage
- More paths for value creation
- Greater exit options
Lower pricing begets lower leverage: The average purchase price multiple for middle market transactions is 34% lower than large cap transactions likely driven by a combination of the following factors:5
- A higher perceived level of risk due to the smaller average size of the company and the earlier stage of its life cycle compared to large cap companies
- The fragmented nature of the middle market, which creates a lack of broad access to a company’s financial statements, management team track record and corporate governance policies
- The general lack of coverage of middle market companies by investment banks and other capital markets intermediaries
Figure 1: TEV/EBITDA and net debt/EBITDA multiples by transaction size

Source: Pitchbook, all U.S. LBOs as of March 31, 2023. GF Data, an ACG Company, M&A and Leverage Reports as of March 31, 2023. Leverage for all LBOs is calculated taking a simple average of yearly leverage and purchase price multiples from 2003–2018.
Lower purchase prices multiples, in turn, require less leverage to finance middle market buyout transactions. The average middle market transaction typically uses 32% less leverage compared to large cap transactions.5 This is especially important in today’s higher interest rate environment where the rising cost of capital has dampened M&A transaction volumes. Total PE buyout by deal value declined by -33.3% in 2023.6 The U.S. middle market fared much better, yet transaction volumes still declined by -18.9% last year. As a result, middle market transactions accounted for 74% of all buyouts in 2023—an all-time high.7
The middle market showed notable signs of recovery as deal value increased 10.0% in Q4 2023, standing in stark contrast to the broader buyout market, which fell -4.1%.6,7
Many paths to drive value: With higher rates increasing acquisition financing costs, general partners (GPs) must rely more heavily on operational improvements such as growing an acquired firm’s revenue, revitalizing management teams or increasing margins to drive value for their limited partners (LPs). Our desire for well-placed greed must take this real risk to forward returns into consideration.
Examining the historical drivers of value creation in the middle market, however, leaves us with some encouraging takeaways.
- Middle market managers tend to drive significant value creation by growing revenues and margins vs. their large cap peers. A Preqin study found that revenue growth and margin expansion contributed 1.54x and 0.41x respectively to value creation for middle market transactions compared to 0.80x and 0.31x for large cap transactions across all industries and regions from 2006–2019 (Figure 2).
- Morgan Stanley conducted a similar analysis and determined that middle market managers grow revenue and EBITDA by nearly triple the amount of their larger cap peers from the time of purchase to exit (Figure 3).
- As result, middle market transactions have generated higher realized capital multiples (3.75x) than large cap buyout transactions (3.2x) (Figure 2).
Figure 2: Return drivers for middle market buyouts
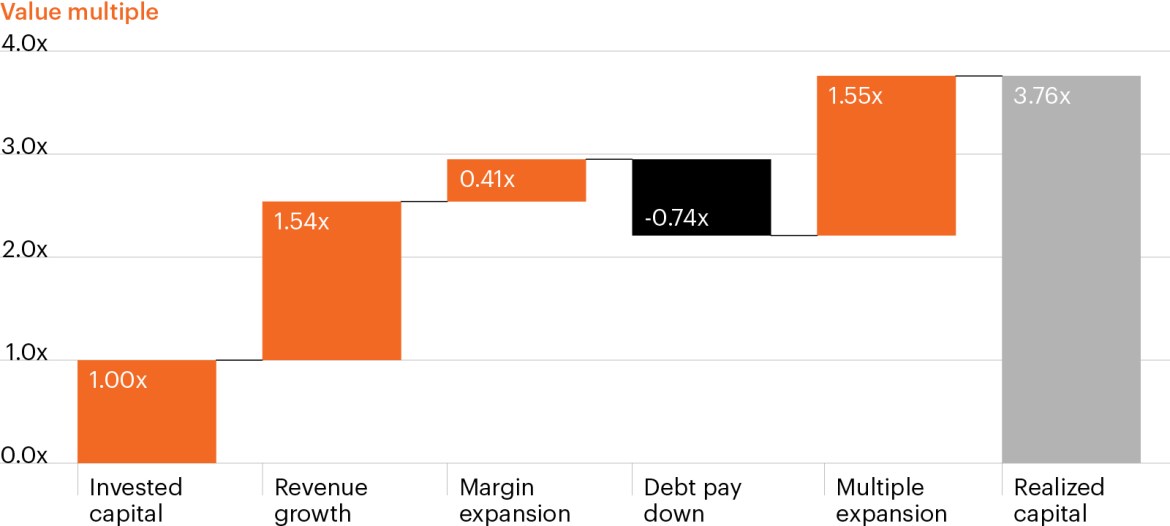
Source: Preqin, as of February 29, 2024.
Figure 3: Weighted average changes from sponsor entry to exit
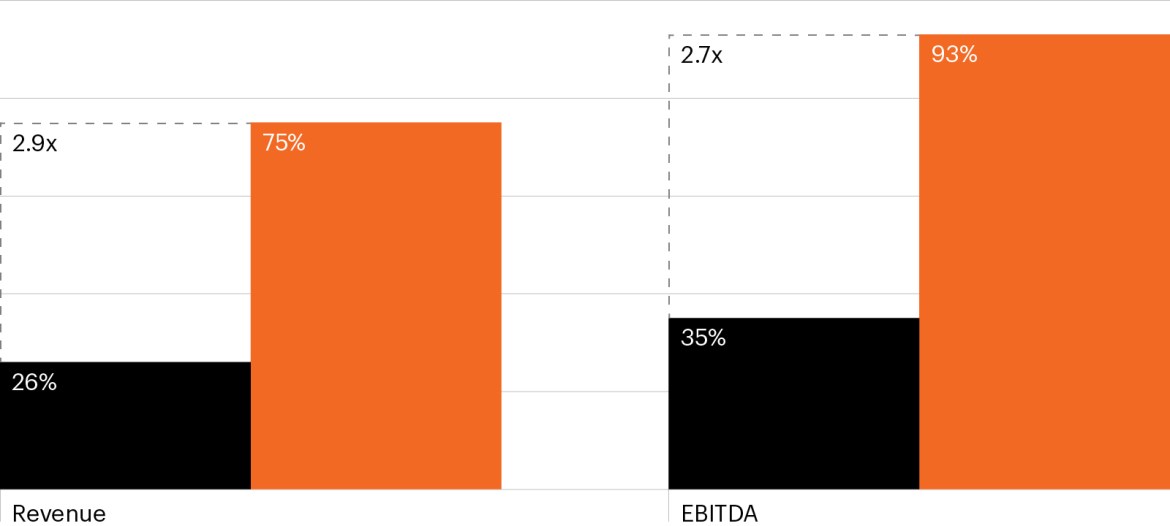
Source: Morgan Stanley Investment Management as of June 30, 2023. Data represents a sample of 166 total transactions including only U.S. deals, excluding Morgan Stanley transactions—37 large cap and 129 middle market—that report on enterprise value, revenue, EBITDA, net debt, public/private company. Middle market is defined as a transactions value of $500M or less.
Greater options for exit: Lastly, as the saying goes, one investor’s exit is another’s entry point. Middle market managers have greater exit options beyond the IPO markets, a common avenue for large cap exits. In fact, from 2018–2023, approximately 97% of middle market exits were through sales to larger private equity sponsors (i.e., large cap funds) or to strategic corporate buyers via M&A activity (Figure 4).6 While holding periods are extending across the PE market, they are generally shorter for middle market portfolio companies than the broader market.
Figure 4 : Share of middle market exit value by type6

Source: Pitchbook Q1 2024 Annual U.S. Private Equity Breakdown.
Well-placed greed in a fragmented frontier
We believe the U.S. middle market will continue to provide an attractive opportunity set versus large and mega cap managers as the segment offers capital structures less reliant on leverage, differentiated value creation strategies and greater exit opportunities. While the opportunity set for middle market buyout managers remains large given the market’s size and relative inefficiencies, we emphasize the importance of manager selection as the market is relatively fragmented consisting of over 400 mid-cap focused buyout funds.8 Investors should look for managers with operational expertise, advantages in deal sourcing and industry specialization to help drive outperformance.