
As yields have risen in fixed income (bonds) this year, there has been an urge for investors and market participants to repeatedly assume yields have peaked and have nowhere to go but down. However, of the three driving forces behind higher yields (higher Fed funds rate, shrinking Fed balance sheet and money supply, and four-decade high inflation levels), only one has arguably peaked at almost unimaginably high levels as recently as a year ago: inflation. The other driving forces (higher Fed funds rate, shrinking Fed balance sheet and money supply) continue to point to higher yields, at least in the short term.
- Return-free risk no longer: While it is true fixed income is no longer the definition of return-free risk as the asset class was coming into 2022, we are still baffled by the willingness of investors to conclude the still relatively low yields are worth the duration risk, particularly at longer maturities.1 And remember, it has taken seven months of CPI readings north of 8% just to get the 10-year Treasury yield to 4.25% for a picosecond!
- Comparing yields: We believe the best way to highlight the divergence between income-generated vs. duration risk (interest rate sensitivity) is to compare absolute levels of pre- and after-tax adjusted yields/income, as well as the ratio of pre- and after-tax adjusted yields/income, to duration. You can see these statistics in the two charts, below, for a variety of fixed income and fixed income replacement strategies. Now that shorter-dated Treasury yields and money market yields have increased, we have included them as well.
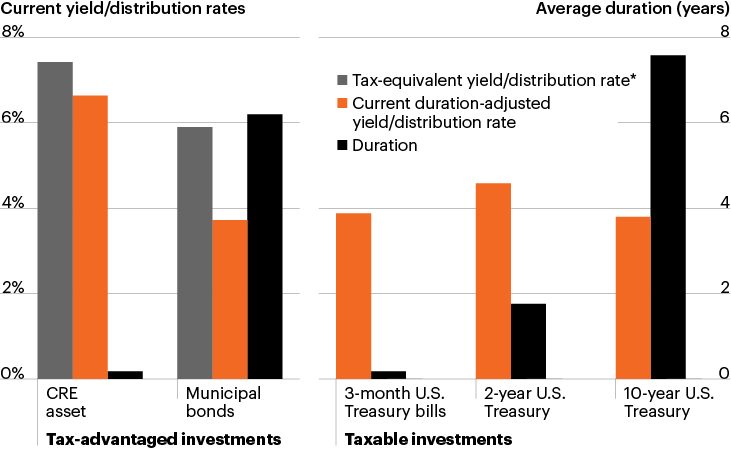
Source: Bloomberg Finance, L.P., as of November 18, 2022. For illustrative purposes only.
*Taxable-equivalent distribution rate reflects the distribution rate required under the prior tax law in order for an investor to receive the same after-tax income under the new tax law. For example, a REIT’s annualized distribution rate would need to be 6.7% under the prior tax law in order for investors to receive the same amount of after-tax income as a REIT with an annualized distribution rate of 6.0% under the new tax law. Assumes a 37% tax bracket. The taxable-equivalent yield equals the after-tax yield of a REIT under the new tax law divided by (1 − tax bracket). The after-tax yield equals the distribution rate multiplied by (1 − effective tax rate). The effective tax rate is the product of an investor’s tax bracket and 80%.
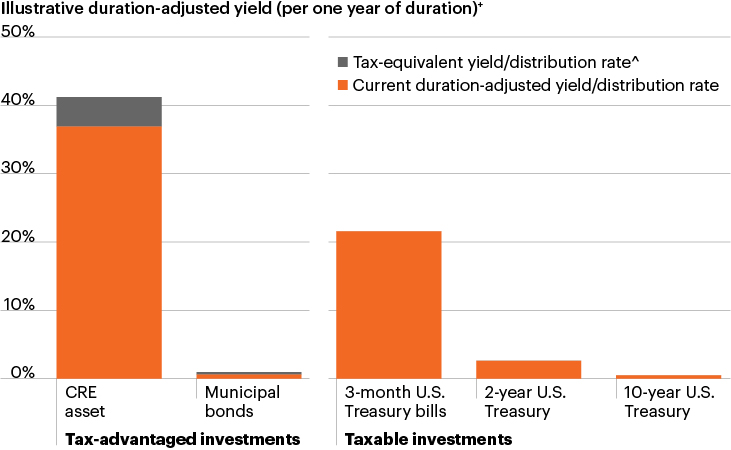
Source: Bloomberg Finance, L.P., as of November 18, 2022. For illustrative purposes only.
+Yield shown is hypothetical. We assume each asset has a duration of one year to compare the hypothetical yield received per unit of duration. Duration-adjusted yield is calculated by dividing the current yield (distribution rate) of the investment shown by its duration.
Yield per unit of duration is measured as yield divided by the underlying asset class’s duration. CRE asset is represented by a CRE focused REIT with an annualized distribution rate of approximately 6.60%, a duration of 0.18 years, and assumes a 37% tax bracket. The taxable-equivalent yield equals the after-tax yield of a REIT under the new tax law divided by (1 − tax bracket). The after-tax yield equals the distribution rate multiplied by (1 − effective tax rate). Money market fund, T-Bill, 2-year treasury, 5-year treasury, 10-year treasury, and Muni Bond Index are represented by the Vanguard Federal Money Market Fund, ICE BofA 0-3 Month Treasury Bill Index, ICE BofA 1-3 Year US Treasury Index, ICE BofA 3-5 Year US Treasury Index, ICE BofA 7-10 Year US Treasury Index, and Bloomberg Municipal Bond Index respectively.
3-month U.S. Treasury bills, 2-year U.S. Treasury, 10-year U.S. Treasury and Municipal bonds are represented by the ICE BofA 3-month U.S. Treasury Index, ICE BofA 1- to 3-Year U.S. Treasury Index, ICE BofA 7- to 10-Year U.S. Treasury Index and Bloomberg Municipal Bond Index, respectively.
^Taxable-equivalent distribution rate reflects the distribution rate required under the prior tax law in order for an investor to receive the same after-tax income under the new tax law. For example, a REIT’s annualized distribution rate would need to be 6.7% under the prior tax law in order for investors to receive the same amount of after-tax income as a REIT with an annualized distribution rate of 6.0% under the new tax law. Assumes a 37% tax bracket. The taxable-equivalent yield equals the after-tax yield of a REIT under the new tax law divided by (1 − tax bracket). The after-tax yield equals the distribution rate multiplied by (1 − effective tax rate). The effective tax rate is the product of an investor’s tax bracket and 80%.
- The outcome won’t be driven by the income: The major driver of investment outcomes prior to maturity for longer duration income streams (municipal bonds, longer-dated Treasuries) will not be the income. The major driver will be the direction of interest rates. Even for shorter-dated fixed income, the income per unit of duration is much lower than floating rate strategies like senior secured commercial real estate loans.2
- Floating rate potential: This does not even include the potential for higher future income streams from floating rate strategies. We’ve said it before and we’ll say it again, “Don’t fight the Fed, high five the Fed.”
- Bonds aren’t the only asset class driven by duration: Speaking of outcomes driven by duration, let’s take a look at the risk/reward profile of the ultimate long duration asset: Equities. We did not include the S&P 500 in the chart above because a 5.7% earnings yield and a 1.66% dividend yield divided by infinity is a really small number! The earnings yield is based on consensus earnings growth of 5% next year, which is a highly dubious assumption given the extremely high probability of a recession beginning Q2 to late 2023. With money supply growing less than nominal GDP, it’s almost a certainty that equities make lower lows based on that alone and then the ultimate low of the current bear market will be caused by a recession-driven decline in earnings. Why take that duration and mark-to-market risk to generate income and total return if you don’t have to!
- Playing yesterday’s game: Some readers of this note may sit back and say we are missing the point of reaching for duration for uninspiring income! The goal is in fact just to extend duration, take some mark-to-market pain as yields go higher in the short term, and then benefit from mark-to-market gain once the Fed inevitably cuts rates as the U.S. economy enters a recession. However, this classic pre-recession game plan is fraught with more risk than usual for potentially lower return for the following reasons:
- If the Fed takes the Fed funds rate to 5% or higher and then the yield curve steepens from here (which is now at the highest levels of inversion since the early 1980s), it is entirely possible that the 10-year Treasury yield peaks at 5% or higher (currently at 3.65%).
- Given the spread of inflation to labor and services and the incredible resilience of the labor market so far, it is highly unlikely the Fed cuts aggressively into the next economic downturn. It is far more likely the next rate-cutting cycle is a mirror image of the last glacially-paced hiking cycle when the Fed raised rates only once in 2015, once in 2016, three times in 2017 and four times in 2018, and each hike was 25 bps. During that hiking cycle, they moved slowly to be fairly certain the deflation demon had been slayed. In the next cutting cycle, provided there is not an outright market or economic debacle, they will more than likely move slowly to be certain there is a stake in the heart of the inflation vampire and inflation is actually declining in a sustained manner to hit the long-term target of 2%. The upside from long duration investments will probably be far less impressive than previous cutting cycles.
Lastly and fortunately, access to higher yielding, floating rate strategies is no longer only available to large institutions. Alternative strategies are now democratized and available to a much larger percentage of U.S. investors than in the recent past. The time for alts is now!
Investing in alternatives is different than investing in traditional investments such as stocks and bonds. Alternatives tend to be illiquid and highly specialized. In the context of alternative investments, higher returns may be accompanied by increased risk and, like any investment, the possibility of an investment loss. Investments made in alternatives may be less liquid and harder to value than investments made in large, publicly traded corporations. When building a portfolio that includes alternative investments, financial professionals and their investors should first consider an individual’s financial objectives. Investment constraints such as risk tolerance, liquidity needs and investment time horizon should be determined.