Market Minute
Weekly analysis from the FS Investments Research team
Listen to the podcast. Read the report. Start your week up to date.
April 29, 2024
Listen to the latest Market minute report

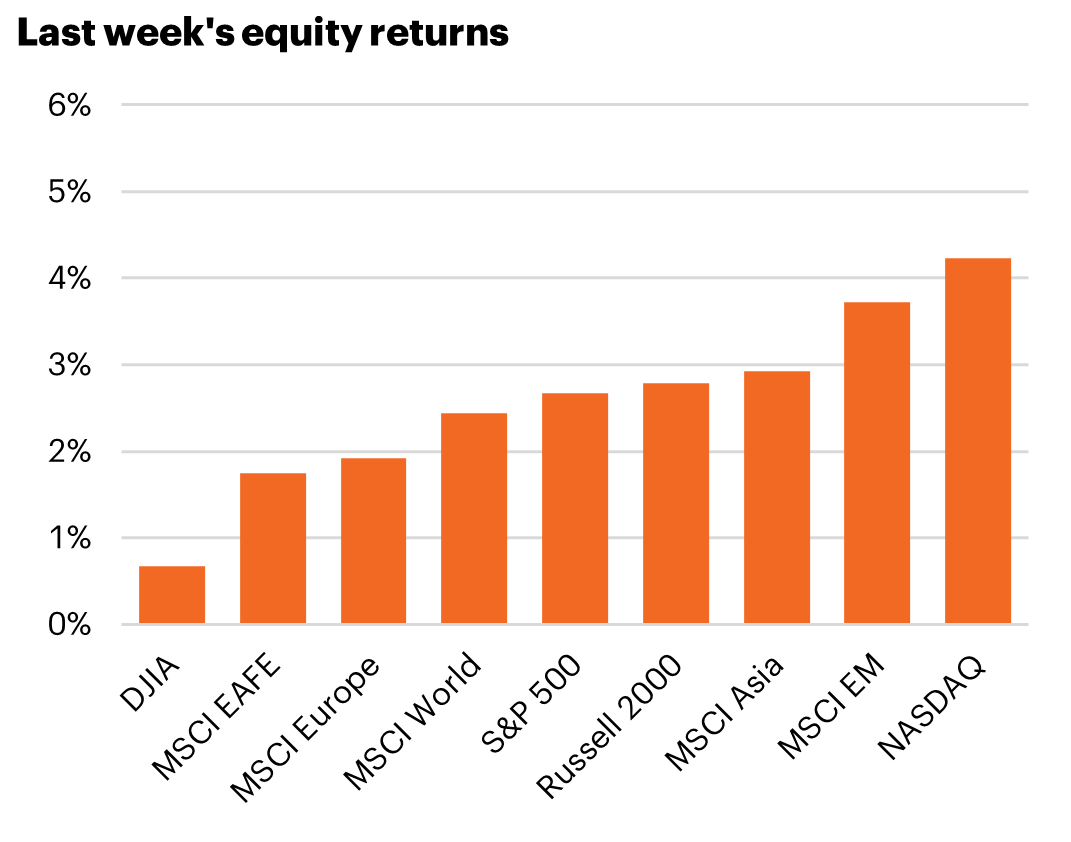
Equities
U.S. stocks gained in a volatile week as Magnificent 7 earnings took center stage. As expected, the common thread was surging AI-related spending, which investors were willing to tolerate only if the firms could display profitability improvements today. Google and Microsoft gained as their Cloud businesses flourished, while Meta was punished for a lack of concrete outcomes. Visa’s earnings confirmed the consumer remains healthy. Overall, with roughly half of S&P 500 market cap having reported, Q1 EPS is running slightly ahead of the 4% growth expectation. Beyond tech’s glitter, it has been factors related to Value and return of capital that have shined over the past month.
Fixed income
Yields continued to grind higher across the curve as the 10-year tested the waters above 4.70% briefly in the wake of the GDP data that included a hotter-than-expected inflation reading. The 10-year ends the week at 4.66%, up 4 bps, the fifth week in a row to see yields climb. Against this backdrop, the erosion of the Bloomberg Agg continues, down –0.08% last week and off -3.19% year-to-date. High yield was up 0.60%, buoyed by equity markets.
Commodities
Oil prices rose slightly amid mixed economic data and a weaker dollar. The most significant move in commodities over the past few weeks has been not in energy, but in metals. Copper prices have surged near $10,000, a 17% increase over the past two months. Similar moves can be seen in nickel, aluminum, and zinc as industrial metals have been boosted by improving global growth and supply shortages. Gold declined, finally relenting to real rates.
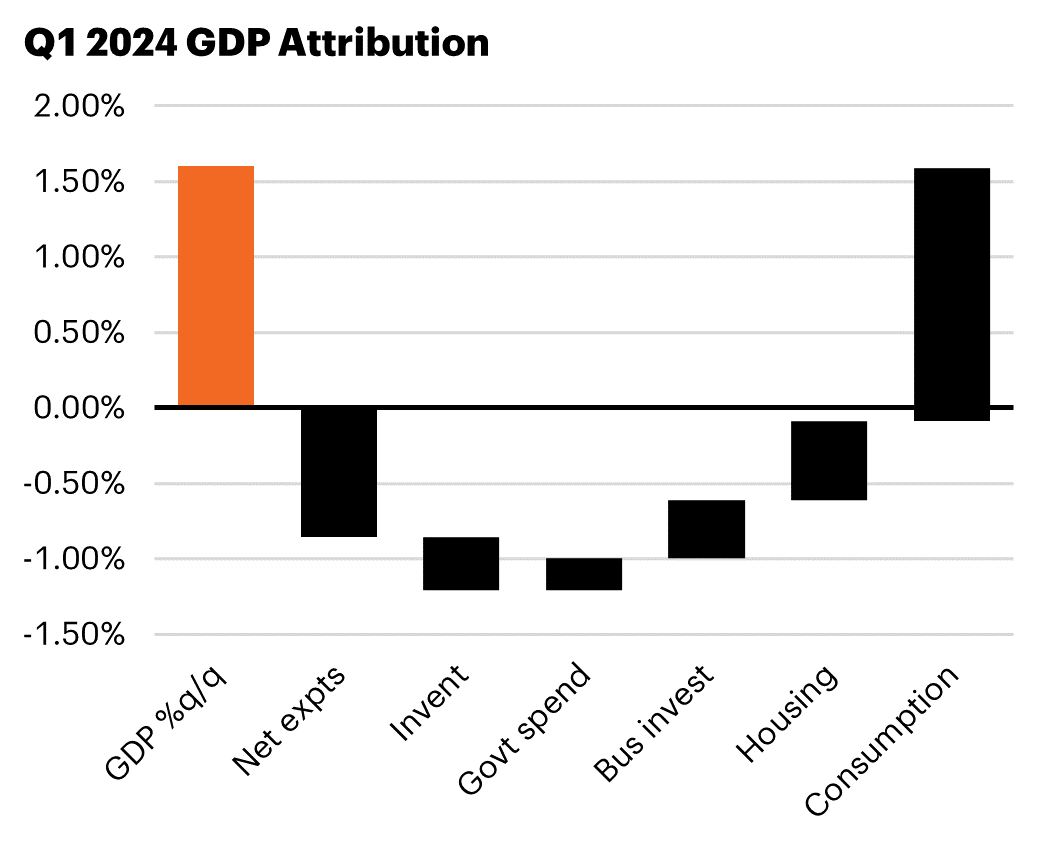
Economic overview
The economy grew 1.6% q/q in Q1. While the headline was lower than the expected 2.5%, the underlying data show broad-based and robust growth. Consumption rose 2.5%, a more sustainable pace than the 3+% growth of the prior two quarters. Business spending rose 2.9%, and residential investment – home building – added 5-tenths to GDP. Government spending slowed but was still positive, while net exports shaved almost a full percentage off growth as sluggish export growth caused the trade balance to widen by $55 billion. The core PCE deflator was hotter than expected at 3.7%, in line with other recent inflation data.
Source: Bloomberg Finance, L.P., as of 1:00pm on 4/19/24.