More of our insights
Showing 13–18 insights out of 107 results
Chart of the week
Equity market to remain rate dependent in 2024?
This week’s chart finds the bulk of the S&P’s returns last year came on days when rates fell. So far, 2024 has followed a similar pattern.

Chart of the week
Stock-bond correlation hits multi-decade high
Stock-bond correlation spiked in 2023 to a 40-year high. This week’s chart looks at how it exacerbates the diversification challenge.

Strategy note
Time to start rotating out of cash and T-bills? The time for the right alts is still now
2023 Year-end strategy note

Chart of the week
Small caps show signs of economic stress?
This week’s chart looks at the rising percentage of small cap companies reporting negative earnings as public index returns mostly remain in neutral.

Chart of the week
Inflation data drives market volatility
As the market remains focused on inflation, this week’s chart looks at S&P returns on days when CPI is released compared to non-release days.
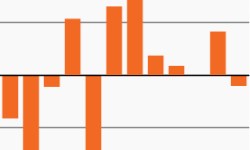
Chart of the week
Sentiment and spending fight it out
Consumer sentiment and spending are telling two different stories, which could lead to differing economic outlooks.

Showing 13–18 insights out of 107 results