Chart of the week

Small caps show signs of economic stress?

This week’s chart looks at the rising percentage of small cap companies reporting negative earnings as public index returns mostly remain in neutral.

December 1, 2023 | 2 minute read

Percentage of Russell 2000 companies with negative earnings

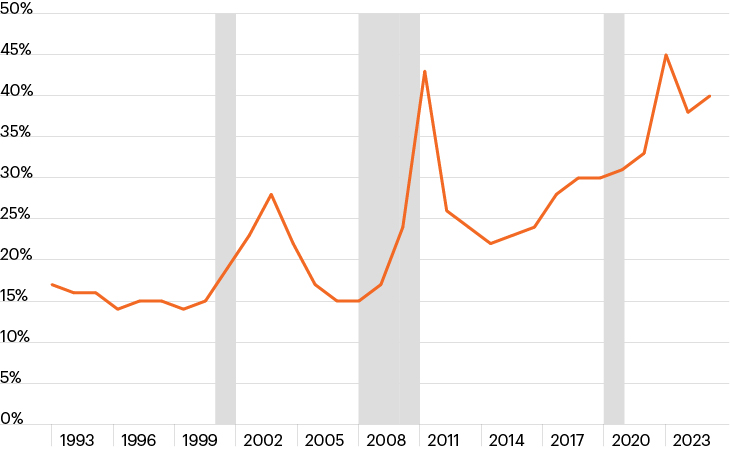
Source: Bloomberg Finance, L.P., as of November 21, 2023. Shaded areas represent economic recessions.

  • The number of public companies has significantly declined over the last 20 years due to the skyrocketing costs of being a public company combined with the need to prioritize short-term analyst expectations over long-term growth. Not only is the public investing pie getting smaller, but the growth outlook for many public companies has also become cloudier.
  • While the top seven, mega-cap growth stocks in the S&P 500 are up an astronomical 80% year to date, the other 493 stocks in the Index are about flat on the year.1
  • Small cap markets are even more challenged as the growth outlook has weakened for many small and medium-sized businesses. The Russell 2000 Index has generated a headline return of just 3.9% year to date while approximately 40% of the companies in the Index are producing negative earnings, up from about 15% in the 1990s.1
  • Against this backdrop, investors may be wise to diversify their portfolios, including integrating investments in private middle market companies as they seek to better match the shifting opportunity set available to growth-oriented investors today.

  • Bloomberg Finance, L.P., as of November 30, 2023. Top seven contributors refer to a market-cap weighted index of Apple, Amazon, Microsoft, Nvidia, Alphabet, Meta and Tesla. Past performance is no guarantee of future results.

The chart of the week and any accompanying data is for informational purposes only and shall not be considered an investment recommendation or promotion of FS Investments or any FS Investments fund. The chart of the week is subject to change at any time based on market or other conditions, and FS Investments and FS Investment Solutions, LLC disclaim any responsibility to update such market commentary. The chart of the week should not be relied on as investment advice, and because investment decisions for the FS Investments funds are based on numerous factors, may not be relied on as an indication of the investment intent of any FS Investments fund. None of FS Investments, its funds, FS Investment Solutions, LLC or their respective affiliates can be held responsible for any direct or incidental loss incurred as a result of any reliance on the chart of the week or other opinions expressed therein. Any discussion of past performance should not be used as an indicator of future results.

This information is educational in nature and does not constitute a financial promotion, investment advice or an inducement or incitement to participate in any product, offering or investment. FS Investments is not adopting, making a recommendation for or endorsing any investment strategy or particular security. All views, opinions and positions expressed herein are that of the author and do not necessarily reflect the views, opinions or positions of FS Investments. All opinions are subject to change without notice, and you should always obtain current information and perform due diligence before participating in any investment. FS Investments does not provide legal or tax advice and the information herein should not be considered legal or tax advice. Tax laws and regulations are complex and subject to change, which can materially impact any investment result. FS Investments cannot guarantee that the information herein is accurate, complete, or timely. FS Investments makes no warranties with regard to such information or results obtained by its use, and disclaims any liability arising out of your use of, or any tax position taken in reliance on, such information.

Any projections, forecasts and estimates contained herein are based upon certain assumptions that the author considers reasonable. Projections are necessarily speculative in nature, and it can be expected that some or all of the assumptions underlying the projections will not materialize or will vary significantly from actual results. The inclusion of projections herein should not be regarded as a representation or guarantee regarding the reliability, accuracy or completeness of the information contained herein, and neither FS Investments nor the author are under any obligation to update or keep current such information.

All investing is subject to risk, including the possible loss of the money you invest.

Search our site