More of our insights
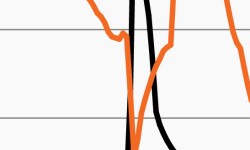
A slog ahead? Leading indicators point to a downturn
Data points toward a potential slog as leading economic indicators weaken. This week’s chart looks at why markets could remain choppy.
Competing data confound markets again
Retail sales data and sentiment moved in opposite directions. This week’s chart looks at the divide, why the competing data could drive volatility.

Regime shift in equity markets?
After a down decade, international stocks are showing signs of life again. This week’s chart looks at international stocks’ recent outperformance.

Margin Stall: Examining the outlook for free cash flow margins
Rising free cash flow margins have been the principal driver of stellar equity returns. In this report, we apply a quantitative lens to margin expansion and examine the ramifications of a trend reversal for markets.

Hawkish Fed to remain a challenge in 2023?
Markets don’t seem to believe Fed policy makers. This week’s chart looks at why market-based Fed funds rate expectations could drive volatility.

Stock-bond correlation could remain elevated in 2023
As inflation moderates to a still-elevated level, this week’s chart looks at stock-bond correlations across different inflation environments.
