More of our insights
Showing 31–36 insights out of 116 results
Chart of the week
Concentrated equity market persists in 2023
This week’s chart looks at the massive divide between year-to-date returns on the Big 7 tech stocks and the rest of the S&P 500.

Strategy note
Dare to dream part II—The time for private credit is now!
A new strategy note from Chief Market Strategist Troy Gayeski

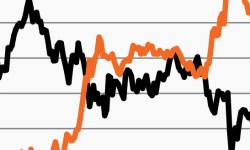
Chart of the week
Equity and Treasury markets agree: Expect volatility
The MOVE Index spiked from an elevated level while the VIX moved up, but from a decade-plus low.
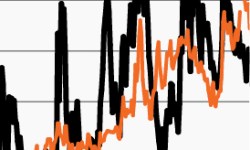
Chart of the week
Falling equity yields predicting too rosy a scenario?
As the equity premium has declined, stocks may not be compensating investors given today’s macro risks.
Playbook
Charted territory: Mixed market signals
The economic outlook is highly uncertain. Our quantitative team analyzes what markets are signaling about a possible recession, and what false signals may need to be actively managed.

Chart of the week
Recession or not, equity return backdrop is challenged
Stocks have seen strong year-to-date (YTD) returns, but high valuations portend challenges ahead as this week’s chart shows.
Showing 31–36 insights out of 116 results