Chart of the week

2020: The year the “40” broke?

A tale of two halves? Our chart looks at the Barclays Agg’s uneven 2020 and what it could mean for fixed income investors in 2021.

December 18, 2020 | 2 minute read

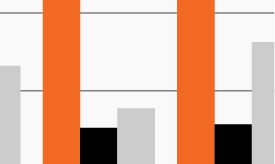
The Barclays Agg saw two very different halves in 2020

Source: Bloomberg Finance, L.P., as of December 15, 2020. Barclays Agg refers to the Bloomberg Barclays U.S. Aggregate Bond Index.

  • With YTD returns of 16.4% and 7.1% for the S&P 500 and Barclays Agg, respectively, 2020 was another banner year for the 60/40 portfolio, which refers to a 60% allocation to equities (growth) and 40% to traditional bonds (income).1
  • Backed by significant vaccine and economic optimism, equity investors remain upbeat about the prospects for another strong year in 2021. The outlook for traditional bonds, however, looks notably murkier as the main driver behind their strong returns of the past several years—declining interest rates—may have reached an inflection point in 2020.
  • The chart looks at the YTD return for the Barclays Agg, breaking it down into the first and second half of the year. It highlights the tight spot traditional bond investors find themselves in today, as more than 85% of the Agg’s YTD return came from January to June, when interest rates plunged from low to historically low.1
  • Returns have sputtered in the second half of this year, though, as the yield on the 10-year U.S. Treasury has seen a mild increase of a little less than 50 basis points and looks set to end the year just under the 1% mark. If the 10-year yield increases just another 0.50%, the Agg would experience losses of approximately 3%—completely wiping out income returns.1
  • The Agg’s two very different halves this year underscore the conundrum for fixed income investors. Traditional bonds offer investors minimal income but also have little prospect for further price gains, given the still-very-low rate environment.

  • Bloomberg Finance, L.P., as of December 15, 2020. Barclays Agg refers to the Bloomberg Barclays U.S. Aggregate Bond Index.

The chart of the week and any accompanying data is for informational purposes only and shall not be considered an investment recommendation or promotion of FS Investments or any FS Investments fund. The chart of the week is subject to change at any time based on market or other conditions, and FS Investments and FS Investment Solutions, LLC disclaim any responsibility to update such market commentary. The chart of the week should not be relied on as investment advice, and because investment decisions for the FS Investments funds are based on numerous factors, may not be relied on as an indication of the investment intent of any FS Investments fund. None of FS Investments, its funds, FS Investment Solutions, LLC or their respective affiliates can be held responsible for any direct or incidental loss incurred as a result of any reliance on the chart of the week or other opinions expressed therein. Any discussion of past performance should not be used as an indicator of future results.

This information is educational in nature and does not constitute a financial promotion, investment advice or an inducement or incitement to participate in any product, offering or investment. FS Investments is not adopting, making a recommendation for or endorsing any investment strategy or particular security. All views, opinions and positions expressed herein are that of the author and do not necessarily reflect the views, opinions or positions of FS Investments. All opinions are subject to change without notice, and you should always obtain current information and perform due diligence before participating in any investment. FS Investments does not provide legal or tax advice and the information herein should not be considered legal or tax advice. Tax laws and regulations are complex and subject to change, which can materially impact any investment result. FS Investments cannot guarantee that the information herein is accurate, complete, or timely. FS Investments makes no warranties with regard to such information or results obtained by its use, and disclaims any liability arising out of your use of, or any tax position taken in reliance on, such information.

Any projections, forecasts and estimates contained herein are based upon certain assumptions that the author considers reasonable. Projections are necessarily speculative in nature, and it can be expected that some or all of the assumptions underlying the projections will not materialize or will vary significantly from actual results. The inclusion of projections herein should not be regarded as a representation or guarantee regarding the reliability, accuracy or completeness of the information contained herein, and neither FS Investments nor the author are under any obligation to update or keep current such information.

All investing is subject to risk, including the possible loss of the money you invest.

Search our site