Chart of the week

For core fixed income, a difficult run gets worse

Long-duration fixed income has had a tough start to the year. This week’s chart looks at its declining monthly returns as rates have risen.

February 11, 2022 | 2 minute read

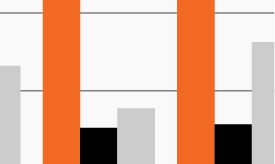
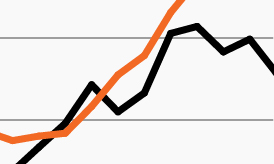
Agg return by month and 10-Year U.S. Treasury yield

Source: Bloomberg Finance L.P., as of February 10, 2022. Agg refers to the Bloomberg U.S. Aggregate Bond Index.

  • Thursday’s inflation data caught markets by surprise and added fuel to the fire of challenges for investors— especially within long-duration, traditional fixed income.
  • Since the start of 2022, the 10-Year U.S. Treasury yield has risen by approximately 51 bps, topping 2.0% this week for the first time since mid-2019.1 The sudden spike has negatively impacted core fixed income returns.
  • As the chart shows, the Bloomberg U.S. Aggregate Bond Index (the Agg) has generated negative returns in five out of the last eight months and appears on track to make it six out of nine.1 The Agg had its worst monthly performance in January (-2.15%) since November 2016.1
  • Inflationary pressures have broadened and accelerated this year. Markets are now pricing in more than six rate hikes in 2022, with about even odds of a 50 basis-point rate hike in March.1
  • The strong wind that was at fixed income investors’ backs for much of the past four decades has begun blowing more firmly in the opposite direction.
  • Against this backdrop, the search for alternative sources of income and return is perhaps more needed today than at any time over the last 10 years, given significant downside risks if rates rise further and limited upside if rates fall given the still low starting point for yields.

  • Bloomberg Finance, L.P., as of February 10, 2022.

The chart of the week and any accompanying data is for informational purposes only and shall not be considered an investment recommendation or promotion of FS Investments or any FS Investments fund. The chart of the week is subject to change at any time based on market or other conditions, and FS Investments and FS Investment Solutions, LLC disclaim any responsibility to update such market commentary. The chart of the week should not be relied on as investment advice, and because investment decisions for the FS Investments funds are based on numerous factors, may not be relied on as an indication of the investment intent of any FS Investments fund. None of FS Investments, its funds, FS Investment Solutions, LLC or their respective affiliates can be held responsible for any direct or incidental loss incurred as a result of any reliance on the chart of the week or other opinions expressed therein. Any discussion of past performance should not be used as an indicator of future results.

This information is educational in nature and does not constitute a financial promotion, investment advice or an inducement or incitement to participate in any product, offering or investment. FS Investments is not adopting, making a recommendation for or endorsing any investment strategy or particular security. All views, opinions and positions expressed herein are that of the author and do not necessarily reflect the views, opinions or positions of FS Investments. All opinions are subject to change without notice, and you should always obtain current information and perform due diligence before participating in any investment. FS Investments does not provide legal or tax advice and the information herein should not be considered legal or tax advice. Tax laws and regulations are complex and subject to change, which can materially impact any investment result. FS Investments cannot guarantee that the information herein is accurate, complete, or timely. FS Investments makes no warranties with regard to such information or results obtained by its use, and disclaims any liability arising out of your use of, or any tax position taken in reliance on, such information.

Any projections, forecasts and estimates contained herein are based upon certain assumptions that the author considers reasonable. Projections are necessarily speculative in nature, and it can be expected that some or all of the assumptions underlying the projections will not materialize or will vary significantly from actual results. The inclusion of projections herein should not be regarded as a representation or guarantee regarding the reliability, accuracy or completeness of the information contained herein, and neither FS Investments nor the author are under any obligation to update or keep current such information.

All investing is subject to risk, including the possible loss of the money you invest.

Search our site