Chart of the week

In 2023, the Agg has seen little bounce-back

The Agg has lost steam with three consecutive monthly declines. This week’s chart tracks its monthly returns against the 10-year yield.

August 4, 2023

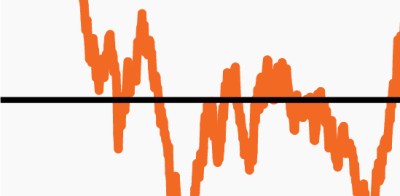
Bloomberg Agg monthly returns amid rising rate

Source: Bloomberg Finance, L.P., as of Aug. 2, 2023. Bloomberg Agg refers to the Bloomberg U.S. Aggregate Index. 10-year Treasury yield shows the yield on the last trading day of each month.

  • The traditional 60/40 portfolio had a strong start to the year, returning 11.6% after a historically poor 2022.
  • Returns have been overwhelmingly driven by the 60, with the S&P 500 up nearly 19% year to date, despite high valuations and an uncertain macro backdrop.1
  • The Bloomberg Agg has only returned 1.1% year to date, despite many investors’ beliefs it would benefit from elevated income and the potential for rates to retreat amid consensus expectations for recession.1
  • Notably, the Agg has turned in negative returns for each of the past three months and is off to a poor, early start in August, driven by the 10-year’s steady rise combined with growing expectations that the Fed may be able to engineer a soft economic landing.1
  • The Agg’s disappointing performance over the past 18 months again highlights the challenge of finding stable sources of income with low volatility outside the traditional 60/40 portfolio.

  • Bloomberg Finance, L.P., as of Aug. 2, 2023. Bloomberg Agg refers to the Bloomberg U.S. Aggregate Index. 10-year Treasury yield shows the yield on the last trading day of each month.

The chart of the week and any accompanying data is for informational purposes only and shall not be considered an investment recommendation or promotion of FS Investments or any FS Investments fund. The chart of the week is subject to change at any time based on market or other conditions, and FS Investments and FS Investment Solutions, LLC disclaim any responsibility to update such market commentary. The chart of the week should not be relied on as investment advice, and because investment decisions for the FS Investments funds are based on numerous factors, may not be relied on as an indication of the investment intent of any FS Investments fund. None of FS Investments, its funds, FS Investment Solutions, LLC or their respective affiliates can be held responsible for any direct or incidental loss incurred as a result of any reliance on the chart of the week or other opinions expressed therein. Any discussion of past performance should not be used as an indicator of future results.

This information is educational in nature and does not constitute a financial promotion, investment advice or an inducement or incitement to participate in any product, offering or investment. FS Investments is not adopting, making a recommendation for or endorsing any investment strategy or particular security. All views, opinions and positions expressed herein are that of the author and do not necessarily reflect the views, opinions or positions of FS Investments. All opinions are subject to change without notice, and you should always obtain current information and perform due diligence before participating in any investment. FS Investments does not provide legal or tax advice and the information herein should not be considered legal or tax advice. Tax laws and regulations are complex and subject to change, which can materially impact any investment result. FS Investments cannot guarantee that the information herein is accurate, complete, or timely. FS Investments makes no warranties with regard to such information or results obtained by its use, and disclaims any liability arising out of your use of, or any tax position taken in reliance on, such information.

Any projections, forecasts and estimates contained herein are based upon certain assumptions that the author considers reasonable. Projections are necessarily speculative in nature, and it can be expected that some or all of the assumptions underlying the projections will not materialize or will vary significantly from actual results. The inclusion of projections herein should not be regarded as a representation or guarantee regarding the reliability, accuracy or completeness of the information contained herein, and neither FS Investments nor the author are under any obligation to update or keep current such information.

All investing is subject to risk, including the possible loss of the money you invest.

Search our site