Chart of the week

A compelling growth opportunity in private equity secondaries?

This week’s chart looks at private equity secondaries’ outperformance versus the broader PE market, focusing on what has driven the outperformance.

March 1, 2024 | 3 minute read

Performance gap widens for secondaries

Line chart showing private equity secondaries outperforming other forms of private equity for the vintage years from 2000-2020.

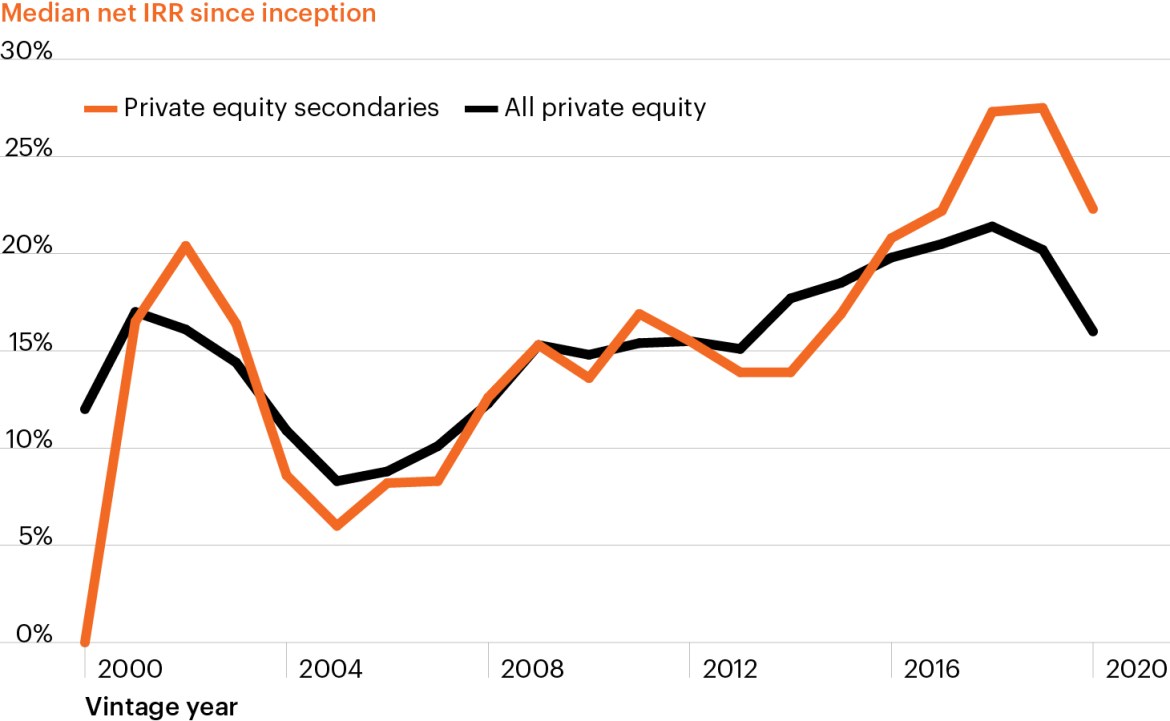
Source: Preqin Global Report 2024: Private Equity, June 30, 2023.

  • Private equity (PE) assets under management have grown exponentially over the past decade as investors increasingly seek diversified sources of growth outside of public markets.
  • The growth in the PE market has created demand from general partners (GPs) and limited partners (LPs) alike for a deeper and more active secondary market to help market participants manage liquidity needs.
  • As this week’s chart shows, private equity secondary funds have outperformed the broader private equity fund universe in recent years driven by strong underlying portfolio company performance and attractive pricing discounts as supply has outweighed available investor capital, among other factors.1
  • In addition to strong absolute and relative returns, PE secondaries have exhibited low correlation to stocks, bonds and primary PE funds.2 This can, in part, be attributed to the countercyclical attributes of PE secondary funds as traditional paths for exiting primary fund interests (e.g., IPOs and strategic buyers) may be less viable during periods of market volatility, raising the “liquidity premium” PE secondary investors may earn.
  • When combined in a portfolio, secondaries may provide a single-point-of-entry for diversification across PE strategies, sectors and vintage years, while retaining exposure to the core value drivers of private equity.

  • Preqin Global Report 2024: Private Equity, December 31, 2024.

  • Preqin Pro and Bloomberg Finance, L.P., as of December 31, 2024.

The chart of the week and any accompanying data is for informational purposes only and shall not be considered an investment recommendation or promotion of FS Investments or any FS Investments fund. The chart of the week is subject to change at any time based on market or other conditions, and FS Investments and FS Investment Solutions, LLC disclaim any responsibility to update such market commentary. The chart of the week should not be relied on as investment advice, and because investment decisions for the FS Investments funds are based on numerous factors, may not be relied on as an indication of the investment intent of any FS Investments fund. None of FS Investments, its funds, FS Investment Solutions, LLC or their respective affiliates can be held responsible for any direct or incidental loss incurred as a result of any reliance on the chart of the week or other opinions expressed therein. Any discussion of past performance should not be used as an indicator of future results.

This information is educational in nature and does not constitute a financial promotion, investment advice or an inducement or incitement to participate in any product, offering or investment. FS Investments is not adopting, making a recommendation for or endorsing any investment strategy or particular security. All views, opinions and positions expressed herein are that of the author and do not necessarily reflect the views, opinions or positions of FS Investments. All opinions are subject to change without notice, and you should always obtain current information and perform due diligence before participating in any investment. FS Investments does not provide legal or tax advice and the information herein should not be considered legal or tax advice. Tax laws and regulations are complex and subject to change, which can materially impact any investment result. FS Investments cannot guarantee that the information herein is accurate, complete, or timely. FS Investments makes no warranties with regard to such information or results obtained by its use, and disclaims any liability arising out of your use of, or any tax position taken in reliance on, such information.

Any projections, forecasts and estimates contained herein are based upon certain assumptions that the author considers reasonable. Projections are necessarily speculative in nature, and it can be expected that some or all of the assumptions underlying the projections will not materialize or will vary significantly from actual results. The inclusion of projections herein should not be regarded as a representation or guarantee regarding the reliability, accuracy or completeness of the information contained herein, and neither FS Investments nor the author are under any obligation to update or keep current such information.

All investing is subject to risk, including the possible loss of the money you invest.

Search our site