Chart of the week

U.S. Treasury yield curve flattens again as inflation data moderates

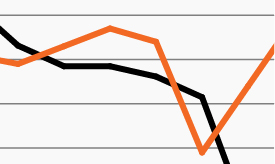
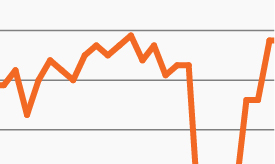
Spread between 10-year and 2-year Treasury notes

March 16, 2018 | 1 minute read
  • Bond investors have tightened their focus on inflation data in recent months, particularly after January’s nonfarm payrolls report suggested U.S. wages were finally beginning to rise.1 Then, January’s stronger-than-expected rise in core CPI prices appeared to confirm the trend of rising prices.2
  • One result was a notable jump in U.S. Treasury yields during the first two months of 2018. By the third week of February, the U.S. 10-year Treasury yield had risen to a four-year high of 2.94%, and the U.S. 30-year Treasury yield was sitting above 3.20% for the first time since 2015.3,4
  • Since then, investor concerns have eased noticeably as recent data suggests inflation pressures remain muted. This week’s CPI report showed headline prices rising only modestly and core prices remaining flat.2 And while February’s nonfarm payrolls report showed a jump in jobs growth, it also showed average hourly earnings growth slowing from January’s pace.1
  • This week, long-end U.S. Treasury yields declined again after U.S. retail sales fell 0.1% in February, further suggesting that U.S. economic growth and inflation remain subdued despite a tightening labor market and rising consumer confidence.5
  • This has translated into a flatter U.S. Treasury yield curve in March than last month. After steepening sharply in early February, the spread between the 10-year and 2-year Treasury yields has declined by approximately 20 basis points as investors, once again, appear to be dialing back their long-run inflation expectations.6
  • With inflation in check, the U.S. Federal Reserve is more likely to remain on its current pace of gradual interest rate increases.

The chart of the week and any accompanying data is for informational purposes only and shall not be considered an investment recommendation or promotion of FS Investments or any FS Investments fund. The chart of the week is subject to change at any time based on market or other conditions, and FS Investments and FS Investment Solutions, LLC disclaim any responsibility to update such market commentary. The chart of the week should not be relied on as investment advice, and because investment decisions for the FS Investments funds are based on numerous factors, may not be relied on as an indication of the investment intent of any FS Investments fund. None of FS Investments, its funds, FS Investment Solutions, LLC or their respective affiliates can be held responsible for any direct or incidental loss incurred as a result of any reliance on the chart of the week or other opinions expressed therein. Any discussion of past performance should not be used as an indicator of future results.

This information is educational in nature and does not constitute a financial promotion, investment advice or an inducement or incitement to participate in any product, offering or investment. FS Investments is not adopting, making a recommendation for or endorsing any investment strategy or particular security. All views, opinions and positions expressed herein are that of the author and do not necessarily reflect the views, opinions or positions of FS Investments. All opinions are subject to change without notice, and you should always obtain current information and perform due diligence before participating in any investment. FS Investments does not provide legal or tax advice and the information herein should not be considered legal or tax advice. Tax laws and regulations are complex and subject to change, which can materially impact any investment result. FS Investments cannot guarantee that the information herein is accurate, complete, or timely. FS Investments makes no warranties with regard to such information or results obtained by its use, and disclaims any liability arising out of your use of, or any tax position taken in reliance on, such information.

Any projections, forecasts and estimates contained herein are based upon certain assumptions that the author considers reasonable. Projections are necessarily speculative in nature, and it can be expected that some or all of the assumptions underlying the projections will not materialize or will vary significantly from actual results. The inclusion of projections herein should not be regarded as a representation or guarantee regarding the reliability, accuracy or completeness of the information contained herein, and neither FS Investments nor the author are under any obligation to update or keep current such information.

All investing is subject to risk, including the possible loss of the money you invest.

Search our site