Chart of the week

Investment grade bonds vulnerable as rates rise

As rising rates have wreaked havoc across markets this year, our chart focuses on the widening duration gap between IG and HY bonds.

January 21, 2022 | 2 minute read

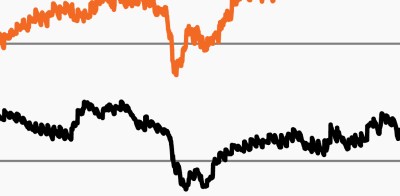
Duration comparison: Investment grade vs. high yield

Source: Bloomberg Finance, L.P., for the period from January 2001 to December 2021. Investment grade represented by the ICE BofAML U.S. Corporate Index. High yield represented by the ICE BofAML High Yield Master II Index.

  • Rising interest rates and a cloudier economic outlook have wreaked havoc on investors this year as equity and fixed income markets have sold off in unison in January.
  • Selling activity in the equity markets has been focused on high-multiple growth stocks while traditional, core fixed income has borne the brunt of the fixed income decline. 
  • Year to date, the Agg has returned -2.07% and investment grade corporate bonds have returned -2.61%.1 That a sharp increase in interest rates would hurt fixed income returns should not surprise investors as bond prices decline when interest rates rise. 
  • It is notable, however, that investment grade bonds have become increasingly vulnerable to rising rates as their duration has drifted steadily higher. As the chart shows, the stated duration on investment grade corporate bonds has risen from 5.7 years in 2000 to 8.3 years as of December 2021.2 Over the same time, high yield’s duration has remained relatively stable, hovering around 5.0 years. (Read about high yield’s negative empirical, or observed, duration here.)
  • As investors prepare for impending Fed rate hikes and the potential for rates to rise further, they may consider revisiting the interest rate risk inherent across both their equity and fixed income portfolios. 

  • As of January 20, 2021. The Agg refers to the Bloomberg U.S. Aggregate Bond Index.

  • Bloomberg Finance, L.P., for the period from January 2001 to December 2021. Investment grade represented by the ICE BofAML U.S. Corporate Index. High yield represented by the ICE BofAML High Yield Master II Index.

The chart of the week and any accompanying data is for informational purposes only and shall not be considered an investment recommendation or promotion of FS Investments or any FS Investments fund. The chart of the week is subject to change at any time based on market or other conditions, and FS Investments and FS Investment Solutions, LLC disclaim any responsibility to update such market commentary. The chart of the week should not be relied on as investment advice, and because investment decisions for the FS Investments funds are based on numerous factors, may not be relied on as an indication of the investment intent of any FS Investments fund. None of FS Investments, its funds, FS Investment Solutions, LLC or their respective affiliates can be held responsible for any direct or incidental loss incurred as a result of any reliance on the chart of the week or other opinions expressed therein. Any discussion of past performance should not be used as an indicator of future results.

This information is educational in nature and does not constitute a financial promotion, investment advice or an inducement or incitement to participate in any product, offering or investment. FS Investments is not adopting, making a recommendation for or endorsing any investment strategy or particular security. All views, opinions and positions expressed herein are that of the author and do not necessarily reflect the views, opinions or positions of FS Investments. All opinions are subject to change without notice, and you should always obtain current information and perform due diligence before participating in any investment. FS Investments does not provide legal or tax advice and the information herein should not be considered legal or tax advice. Tax laws and regulations are complex and subject to change, which can materially impact any investment result. FS Investments cannot guarantee that the information herein is accurate, complete, or timely. FS Investments makes no warranties with regard to such information or results obtained by its use, and disclaims any liability arising out of your use of, or any tax position taken in reliance on, such information.

Any projections, forecasts and estimates contained herein are based upon certain assumptions that the author considers reasonable. Projections are necessarily speculative in nature, and it can be expected that some or all of the assumptions underlying the projections will not materialize or will vary significantly from actual results. The inclusion of projections herein should not be regarded as a representation or guarantee regarding the reliability, accuracy or completeness of the information contained herein, and neither FS Investments nor the author are under any obligation to update or keep current such information.

All investing is subject to risk, including the possible loss of the money you invest.

Search our site