Chart of the week

Credit attractive compared to expensive stocks?

Stocks remain expensive and credit markets may offer an attractive alternative. This week’s chart looks at diverging valuations over time.

June 9, 2023 | 2 minute read

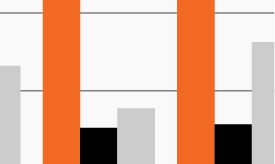
Valuations across asset classes

Source: Bloomberg Finance, L.P., as of June 2, 2023. S&P valuations based on price-to-earning ratios. High yield bonds represented by yields above Treasuries (spreads) on the ICE BofAML U.S. High Yield Bond Index, Senior secured loans represented by yields above Treasuries on the Morningstar/LSTA Leveraged Loan Index. CLOs represented by JP Morgan CLOIE BBB Index.

  • The stock market rally in 2023 has largely been characterized by two factors: Concentration and valuation.
  • Said another way, more than 85% of gains in the S&P 500 year to date can be attributed to seven of the largest stocks in the index while market performance looks much weaker outside several megacap names.1 The rally also has taken place within unusually expensive territory (including for the aforementioned megacap tech stocks).
  • Many investors may not consider this as a particularly attractive entry point for U.S. stocks, which are trading in the 78th percentile according to their price/earnings multiple, but conditions in the corporate credit market are very different.1
  • As the chart highlights, credit market valuations declined significantly last year and have remained notably more attractive. Spreads on high yield bonds and senior secured loans are in the 40th and 26th percentiles, respectively.1 Spreads on collateralized loan obligations (based on discount margins) are in the 15th percentile.1
  • High yield bonds and loans yield 8.6% and 9.2%, respectively, providing cushion to withstand potential spread volatility. Combined with generally supportive balance sheets, corporate credit conditions may provide a relatively attractive entry point for investors seeking to hedge their equity exposure.

  • Bloomberg Finance, L.P., as of June 2, 2023. S&P valuations based on price-to-earning ratios. High yield bonds represented by yields above Treasuries on the ICE BofAML U.S. High Yield Bond Index, Senior secured loans represented by yields above Treasuries on the Morningstar/LSTA Leveraged Loan Index. CLOs represented by JP Morgan CLOIE BBB Index.

The chart of the week and any accompanying data is for informational purposes only and shall not be considered an investment recommendation or promotion of FS Investments or any FS Investments fund. The chart of the week is subject to change at any time based on market or other conditions, and FS Investments and FS Investment Solutions, LLC disclaim any responsibility to update such market commentary. The chart of the week should not be relied on as investment advice, and because investment decisions for the FS Investments funds are based on numerous factors, may not be relied on as an indication of the investment intent of any FS Investments fund. None of FS Investments, its funds, FS Investment Solutions, LLC or their respective affiliates can be held responsible for any direct or incidental loss incurred as a result of any reliance on the chart of the week or other opinions expressed therein. Any discussion of past performance should not be used as an indicator of future results.

This information is educational in nature and does not constitute a financial promotion, investment advice or an inducement or incitement to participate in any product, offering or investment. FS Investments is not adopting, making a recommendation for or endorsing any investment strategy or particular security. All views, opinions and positions expressed herein are that of the author and do not necessarily reflect the views, opinions or positions of FS Investments. All opinions are subject to change without notice, and you should always obtain current information and perform due diligence before participating in any investment. FS Investments does not provide legal or tax advice and the information herein should not be considered legal or tax advice. Tax laws and regulations are complex and subject to change, which can materially impact any investment result. FS Investments cannot guarantee that the information herein is accurate, complete, or timely. FS Investments makes no warranties with regard to such information or results obtained by its use, and disclaims any liability arising out of your use of, or any tax position taken in reliance on, such information.

Any projections, forecasts and estimates contained herein are based upon certain assumptions that the author considers reasonable. Projections are necessarily speculative in nature, and it can be expected that some or all of the assumptions underlying the projections will not materialize or will vary significantly from actual results. The inclusion of projections herein should not be regarded as a representation or guarantee regarding the reliability, accuracy or completeness of the information contained herein, and neither FS Investments nor the author are under any obligation to update or keep current such information.

All investing is subject to risk, including the possible loss of the money you invest.

Search our site