Rising inflation expectations ripple across the markets
Rates and inflation expectations moved higher this week. Our chart looks at why the Fed isn’t concerned, but markets could remain choppy, nonetheless.
Leveraged credit climbs amid rising rate environments
As Treasury yields jump, flexibility is key. This week’s chart looks at historical returns for credit when yields have risen quickly.

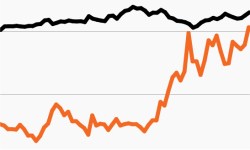
Credit markets a case study on the impact of duration
IG bonds have turned negative over the past 9 months while HY has moved higher. This week’s chart looks at the impact of duration as rates rise.

Amid low rates, CLOs appear attractive
Relative value in the fixed income market? This week’s chart compares CLO spreads to those of HY bonds and explores how to delve into this market.

As long rates surge, the spotlight shines on duration
Treasury rates’ rise this week again placed duration front and center. We look at how rising rates might help certain fixed income sectors.

2020: The year the “40” broke?
A tale of two halves? Our chart looks at the Barclays Agg’s uneven 2020 and what it could mean for fixed income investors in 2021.
