Yields decline despite rising inflationary pressures
As inflation rises, longer-term yields have declined. This week’s chart looks at the yield curve as the hunt for yield gets harder.

Active management paramount even amid healthy credit markets
Credit fundamentals look good, yet finding returns can be tough, especially for passive investors.
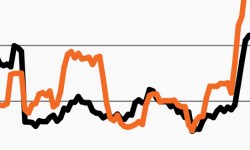
As long rates fall, core fixed income stuck in the middle
Long rates have declined despite rising inflation readings. This week’s chart looks at the declining yield curve and why core FI is in a tough spot.
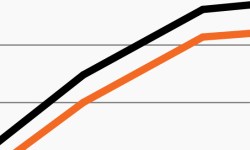
Rate expectations remain near zero for the long term
Prices have risen, but rates remain anchored. This week’s chart looks at Fed funds rate expectations, noting that the income problem is here to stay.
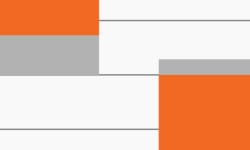
Despite rate pause, the Barclays Agg remains underwater
The Barclays Agg remains in negative territory YTD despite a kinder rate environment. We compare core fixed income returns in 2020 and 2021.
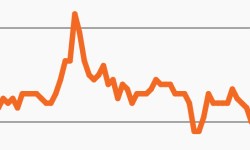
With the 10-year’s decline, a sense of false hope?
The Barclays Agg rose in April for the first time since December. Our chart looks at the secular issues that continue to drag fixed income markets.
