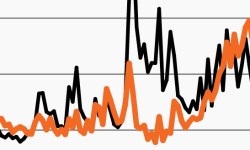
Treasury volatility hits 2008 levels amid macro pressures
Expected Treasury volatility spiked over the past week. This week’s chart looks at the MOVE Index, which rose to its highest point since 2008.
A slog ahead? Leading indicators point to a downturn
Data points toward a potential slog as leading economic indicators weaken. This week’s chart looks at why markets could remain choppy.
Competing data confound markets again
Retail sales data and sentiment moved in opposite directions. This week’s chart looks at the divide, why the competing data could drive volatility.

Stock-bond correlation could remain elevated in 2023
As inflation moderates to a still-elevated level, this week’s chart looks at stock-bond correlations across different inflation environments.

Opportunity for alts as sentiment turns south?
This week’s chart looks at sustained bearish market sentiment, which recently hit a milestone. Contrarian indicator or more volatility ahead?

A challenging tightrope walk for the Fed gets harder
Financial conditions and markets have danced closely together this year. This week’s chart looks at why their latest move may be problematic for the Fed.
