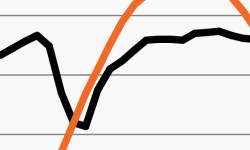
Could investors be counting on an unrequited Fed pivot?
Investors have bet on a Fed pivot recently. Yet, this week’s chart looks at market-based expectations for the Fed funds rate, which have kept rising.
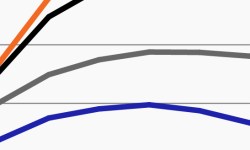
Strong jobs data pose latest challenge to the Fed
With all eyes on jobs, this week’s chart looks at the scale of the Fed’s inflation challenge as employment figures have barely budged this year.
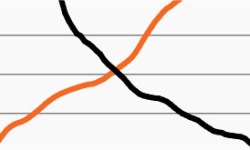
Do rising rates favor CRE debt?
Rising rates have wreaked havoc on markets this year, but this week’s chart points to CRE debt as an area that could potentially benefit from them.

Volatility sinks Treasuries’ risk-return relationship
The risk-return relationship for the risk-free rate has grown riskier. This week’s chart shows the 2-year note’s Sharpe ratio turning deeply negative.

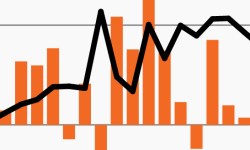
Volatility escalates as yields march higher
As short-end rates march higher, this week’s chart looks at growing rate volatility from two perspectives: weekly yield changes and the MOVE Index.
Rent, labor markets continue to challenge Fed
As the Fed remains determined to temper inflation, this week’s chart looks at two stubborn inflation drivers: shelter and labor markets.