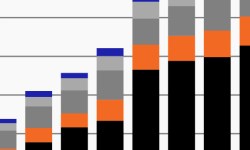
Recession or not, equity return backdrop is challenged
Stocks have seen strong year-to-date (YTD) returns, but high valuations portend challenges ahead as this week’s chart shows.
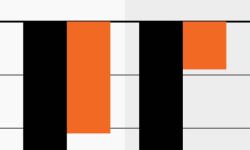
Private markets attractive in market drawdowns?
This week’s chart looks at private markets’ relatively small declines during the past two market drawdowns compared to their public counterparts.
Stock-bond correlation is quickly rising
Stock-bond correlation has been on the rise again. This week’s chart looks at the trend and how it has exacerbated the diversification challenge.
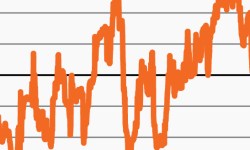
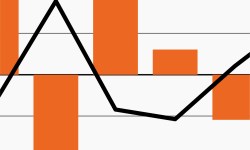
In 2023, the Agg has seen little bounce-back
The Agg has lost steam with three consecutive monthly declines. This week’s chart tracks its monthly returns against the 10-year yield.
Institutions remain cautious, despite market rally
Market sentiment has shifted recently, but there are still reasons for caution. This week’s chart looks at institutions’ somewhat neutral positioning.
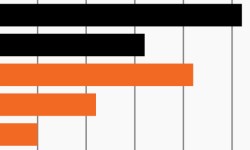
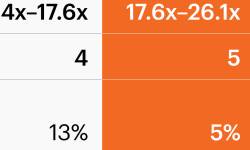
Investor demand for private assets remains robust
As investment opportunities shift, this week’s chart looks at institutions’ historical fundraising across private markets.