Volatility sinks Treasuries’ risk-return relationship
The risk-return relationship for the risk-free rate has grown riskier. This week’s chart shows the 2-year note’s Sharpe ratio turning deeply negative.

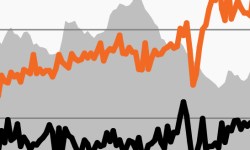
Volatility escalates as yields march higher
As short-end rates march higher, this week’s chart looks at growing rate volatility from two perspectives: weekly yield changes and the MOVE Index.
Global fixed income plummets as policy tightens
As policymakers reset rate expectations, this week’s chart looks at falling performance across the U.S. and Global Agg Indexes.

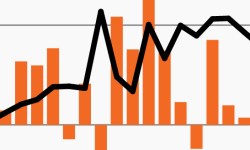
A wide disconnect between investors and the Fed
Markets expect the Fed to be much less hawkish than Fed policymakers do. This week’s chart looks at how the disconnect could drive volatility.
Negative productivity complicates the Fed’s path
Though CPI moderated in July, this week’s chart looks at negative productivity trends that could exaggerate wage pressures and complicate the Fed’s job.
Housing challenges create opportunity in CRE?
Housing data has crumbled under rapid Fed rate hikes. This week’s chart looks at how declining housing investment may mean opportunity in CRE.