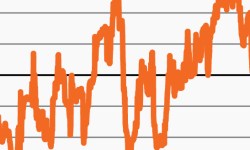
Inflation data drives market volatility
As the market remains focused on inflation, this week’s chart looks at S&P returns on days when CPI is released compared to non-release days.
The Agg headed for a third consecutive annual decline?
This week’s chart looks at the Agg’s recent performance as rising rates provide a formidable headwind for core fixed income.

Concentrated equity market persists in 2023
This week’s chart looks at the massive divide between year-to-date returns on the Big 7 tech stocks and the rest of the S&P 500.

Recession or not, equity return backdrop is challenged
Stocks have seen strong year-to-date (YTD) returns, but high valuations portend challenges ahead as this week’s chart shows.
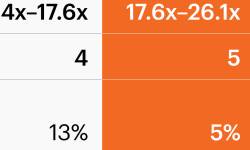
Private markets attractive in market drawdowns?
This week’s chart looks at private markets’ relatively small declines during the past two market drawdowns compared to their public counterparts.

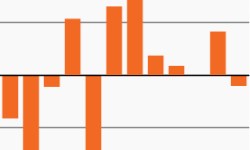
Stock-bond correlation is quickly rising
Stock-bond correlation has been on the rise again. This week’s chart looks at the trend and how it has exacerbated the diversification challenge.