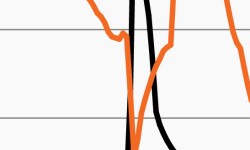
Treasury volatility hits 2008 levels amid macro pressures
Expected Treasury volatility spiked over the past week. This week’s chart looks at the MOVE Index, which rose to its highest point since 2008.
Amid recent market retreat, return expectations plunge.
Have bears taken over the market? This week’s chart looks at the roller-coaster ride for investor sentiment this year.

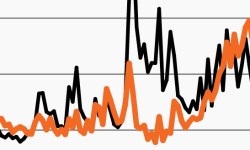
Rates are higher. And significantly more volatile.
As rates have risen, so has rate volatility. This week’s chart looks at the daily changes in the two-year Treasury yield over the past year.

Fed funds rate shows no sign yet of retreating.
Could markets be due for more Fed-driven volatility ahead? This week’s chart looks at market-based Fed rate expectations, which continue to rise.
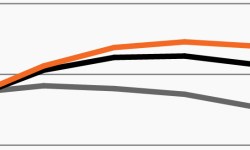
International equities reassert themselves
The current rally looks very different from the last one. This week’s chart looks at the composition of returns in 2023 vs. 2021.
A slog ahead? Leading indicators point to a downturn
Data points toward a potential slog as leading economic indicators weaken. This week’s chart looks at why markets could remain choppy.