Inflation wreaks havoc on traditional assets
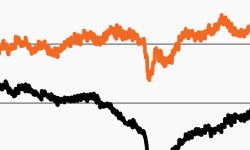
Amid another record CPI print, this week’s chart looks at the S&P 500 and the Agg’s historical returns during periods of elevated inflation.

For core fixed income, a difficult run gets worse
Long-duration fixed income has had a tough start to the year. This week’s chart looks at its declining monthly returns as rates have risen.

The 60/40 starts 2022 in the red
This week’s chart looks at the monthly returns on the 60/40 portfolio, which declined in January and faces a murky outlook in 2022.

Rate volatility returns in a big way, joining stocks
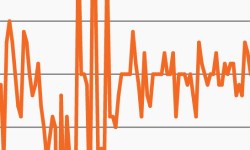
Short rates saw their largest jump in more than year. Our chart focuses on elevated rate volatility this year as equity markets also remain choppy.

Investment grade bonds vulnerable as rates rise
As rising rates have wreaked havoc across markets this year, our chart focuses on the widening duration gap between IG and HY bonds.

As equities rallied in 2021, core fixed income fell
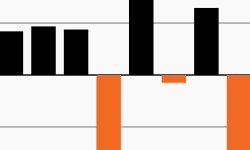
Core fixed income is on pace for its first negative year since 2013. Our chart looks at the Agg’s annual returns, why this year may be different.

