Fed funds rate shows no sign yet of retreating.
Could markets be due for more Fed-driven volatility ahead? This week’s chart looks at market-based Fed rate expectations, which continue to rise.
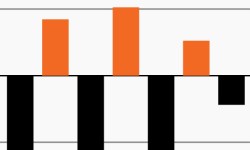
Credit has never had consecutive negative annual returns
Are credit markets poised for a bounce back? They have never seen two consecutive down years. This week’s chart looks at historical credit returns.

Hawkish Fed to remain a challenge in 2023?
Markets don’t seem to believe Fed policy makers. This week’s chart looks at why market-based Fed funds rate expectations could drive volatility.

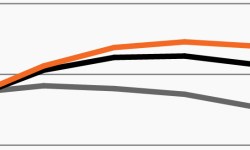
Stock-bond correlation could remain elevated in 2023
As inflation moderates to a still-elevated level, this week’s chart looks at stock-bond correlations across different inflation environments.

As inflation cools, macro alarms sound anew
The 10Y–2Y yield curve inverted to its deepest level in 40 years. This week’s chart looks at the yield curve over time as macro risks remain prominent.

The Agg is no longer balancing equity volatility
As rates keep rising, this week’s chart looks at the 60/40’s historically poor performance, as the Agg has not balanced stocks’ negative returns.