High yield attractive amid elevated yields?
High yield bonds offer attractive income and a potentially good entry point. This week’s chart looks at high yield bond yields and spreads over time.
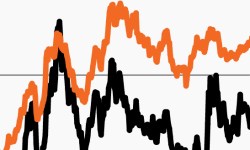
In 2023, the Agg has seen little bounce-back
The Agg has lost steam with three consecutive monthly declines. This week’s chart tracks its monthly returns against the 10-year yield.

Credit attractive compared to expensive stocks?
Stocks remain expensive and credit markets may offer an attractive alternative. This week’s chart looks at diverging valuations over time.
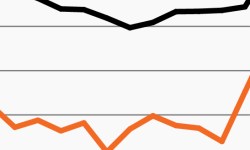
Credit performed well after previous Fed pauses
With the Fed potentially pausing after a May rate hike, this week’s chart looks at credit returns after historical pauses in Fed rate hiking cycles.

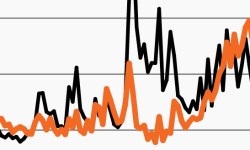
Higher credit spreads could represent unique opportunity
High yield spreads have spiked in March. This week’s chart looks at the YTD move and potential new opportunities in credit.
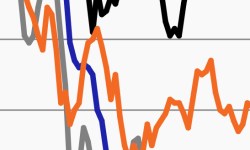
Treasury volatility hits 2008 levels amid macro pressures
Expected Treasury volatility spiked over the past week. This week’s chart looks at the MOVE Index, which rose to its highest point since 2008.