A compelling growth opportunity in private equity secondaries?
This week’s chart looks at private equity secondaries’ outperformance versus the broader PE market, focusing on what has driven the outperformance.
Private and public company earnings taking divergent paths
This week’s chart looks at a shifting opportunity set as the private middle market shines while small cap company earnings remain challenged.

Will a rate-dependent equity market become a headwind?
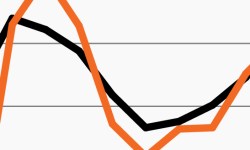
Could last year’s market tailwind turn into this year’s headwind? This week’s chart looks at stocks and rates’ tandem moves over the past year.

Equity market to remain rate dependent in 2024?
This week’s chart finds the bulk of the S&P’s returns last year came on days when rates fell. So far, 2024 has followed a similar pattern.

Stock-bond correlation hits multi-decade high
Stock-bond correlation spiked in 2023 to a 40-year high. This week’s chart looks at how it exacerbates the diversification challenge.

Small caps show signs of economic stress?
This week’s chart looks at the rising percentage of small cap companies reporting negative earnings as public index returns mostly remain in neutral.
