Volatility sinks Treasuries’ risk-return relationship
The risk-return relationship for the risk-free rate has grown riskier. This week’s chart shows the 2-year note’s Sharpe ratio turning deeply negative.

Volatility escalates as yields march higher
As short-end rates march higher, this week’s chart looks at growing rate volatility from two perspectives: weekly yield changes and the MOVE Index.
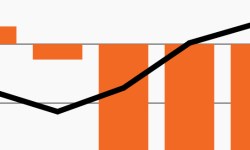
Global fixed income plummets as policy tightens
As policymakers reset rate expectations, this week’s chart looks at falling performance across the U.S. and Global Agg Indexes.

As investors seek quality, broadly syndicated loans wilt
As investors seek higher quality investments, this week’s chart looks at the loan market’s gradual move down in quality.

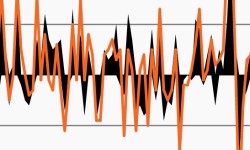
Unrelenting inflation has exaggerated rate volatility
This week’s chart looks at daily yield changes on 2-year and 10-year Treasury yields as rate volatility in 2022 has dwarfed that of last year.
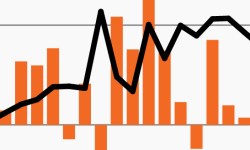
The Agg completes its worst-ever start to a year
Halfway through 2022, this week’s chart revisits the Agg’s monthly returns as expected rate volatility spikes.